


Shadow of the Tomb Raider: PC Performance Benchmarks for Graphics Cards and Processors
| BASIC INFORMATION ON THE GAME |

Release Year : September 12, 2018
Genre : 3D / Action (Adventure) / Shooter / 3rd Person
Developer : Eidos-Montréal, Powered by Crystal Dynamics
Publisher : Square Enix
Shadow of the Tomb Raider has finally received a new patch that adds ray tracing support to the game on RTX series graphics cards (it will also be available on GTX 1XXX family in the near future). As with Metro: Exodus, Shadow of the Tomb Raider supports both tracing and DLSS anti-aliasing.
RTX requires updating to Windows 10 version 1809 and installing GeForce 419.35 (WHQL) drivers.
| COMPARISON OF DIFFERENT SETTINGS |


Real-time ray tracing is used in the game to create realistic shadows. Along with the latest update, Shadow of The Tomb Raider also introduced DLSS Smart Anti-Aliasing, which uses artificial intelligence algorithms to improve game performance while maintaining the specified image quality. NVIDIA recommends using both technologies together. Watch the video:
| TEST PART |
| Test configuration | |
| test stands |
Benchmark #1 based on the Intel Socket 2011 v3 Testbed #2 based on the Intel Socket 2011 platform Test stand #3 based on the Intel Socket 1155 platform Test Bench #4 Based on AMD Socket AM3+ Platform Testbed #5 based on the Intel Socket 1150 platform |
| multimedia equipment | Monitor Philips 241P6 |
| Software configuration |
|
| operating system | Windows 10 Pro |
| Graphics driver |
Nvidia GeForce/ION Driver Release 419.35 |
| Monitoring program |
MSI Afterburner 4.6.14 FRAPS |
Our video cards were tested at 1920x1080, 2560x1600 and 3840x2160 resolutionsin DirectX 12 mode with RTX and DLSS. It is also worth noting that for 2080/Ti the resolution of 1920x1080 is not available when DLSS is activated, only 1920x1200, so it should be taken into account in the graphics that for these video cards at 1920x1080 the resolution of 1920x1200 is implied.
| GPU TEST |


In the test of video cards, the default resolution is 1920x1080, other resolutions are added and removed manually. You can also remove and add any positions of video cards.
NVIDIA GeForce RTX graphics cards provided by LLC Business Development Center.

DirectX 12
In DirectX 12, even in 2K, all video cards give out 60 FPS. But for 4K, a level of at least GeForce RTX 2080 is required .
DirectX 12 +DLSS
When DLSS is activated in 4k, you can already play at average 60 FPS with almost GeForce RTX 2070 .
RTX
At ultra RTX settings, stable 60 frames at 1920x1080 will be provided by GEFORCE RTX 2060, and at 2560x1400 - GeForce RTX 2080 .
RTX+DLSS
Activating DLSS with RTX enabled is most effective at 4K, where performance is almost comparable to this mode without RTX .
| VIDEO MEMORY CONSUMPTION |
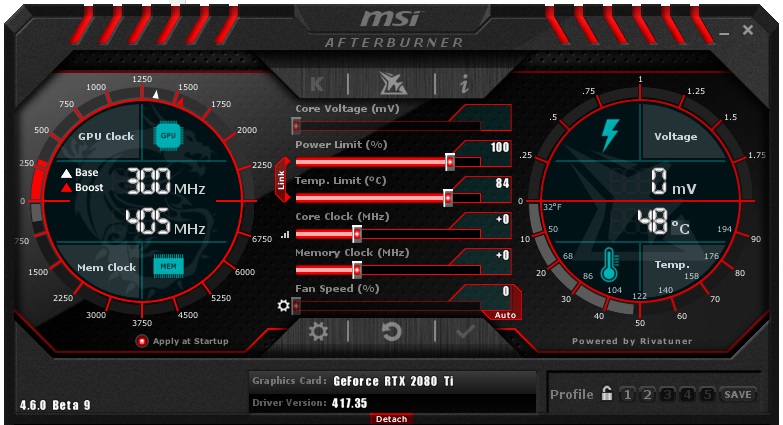
Testing of the video memory consumed by the game was carried out by the MSI Afterburner program. The results on video cards from AMD and NVIDIA at resolutions of 1920x1080 and 2560x1440 with various anti-aliasing settings were taken as the indicator. By default, the graph displays the most up-to-date solutions. Other graphics cards are added and removed from the chart at the reader's request.
GameGPU
DirectX 12
At a resolution of 1920x1080 , video memory consumption for video cards with 6 gigabytes was 4600 megabytes, with 8 gigabytes 4600 megabytes and with 11 gigabytes 4700 megabytes.
At a resolution of 2560x1440, video memory consumption for video cards with 6 gigabytes was 5000 megabytes, with 8 gigabytes 5000 megabytes and with 11 gigabytes 5100 megabytes.
At a resolution of 3840x2160, video memory consumption for video cards with 6 gigabytes was 5700 megabytes, with 8 gigabytes 5600 megabytes and with 11 gigabytes 6100 megabytes.
RTX
At a resolution of 1920x1080, video memory consumption for video cards with 6 gigabytes was 5200 megabytes, with 8 gigabytes 5000 megabytes and with 11 gigabytes 5400 megabytes.
At a resolution of 2560x1440, video memory consumption for video cards with 6 gigabytes was 5500 megabytes, with 8 gigabytes 5500 megabytes and with 11 gigabytes 5900 megabytes.
At a resolution of 3840x2160, video memory consumption for video cards with 6 gigabytes was 5200 megabytes, with 8 gigabytes 6400 megabytes and with 11 gigabytes 6800 megabytes.
| CPU TEST |
Testing was carried out at a resolution of 1920x1080. In the processor test, you can remove and add any positions of the processors. You can also select any tested video card from the list in the drop-down menu, comparing its performance to the given processor tests (by default, the most productive solution from NVIDIA is selected).
DirectX 12
An acceptable FPS of at least 25 frames was shown by the FX 4300 or Core i 3 2100 processors, and an average FPS of at least 60 frames can be provided by solutions of the Ryzen 5 2400 or Core i 3 8100 level .
RTX
An acceptable FPS of at least 25 frames was shown by the FX 6300 or Core i 3 4330 processors, and an average FPS of at least 60 frames can be provided by solutions like Ryzen 5 1600X or Core i 7 7700 .
GameGPU
The game uses a maximum of 16 computing threads.
| RAM TEST |
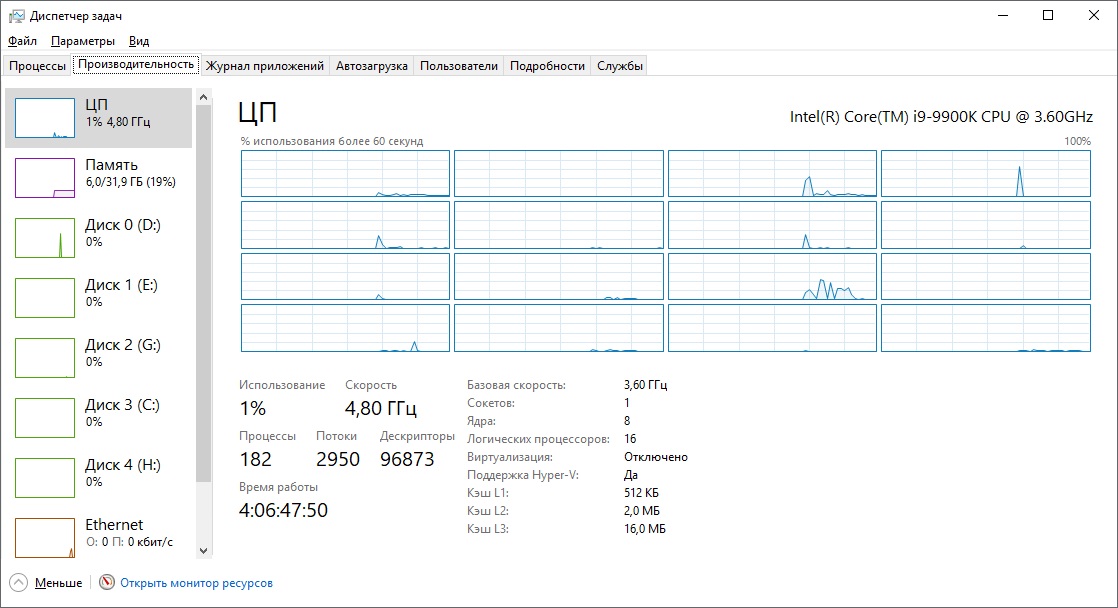
The test was conducted on the base configuration of the Core i 9 9900K with 32 GB DDR4 3200 MGz pre-installed memory. All used RAM was taken as an indicator. The RAM test on the entire system was carried out on various video cards without running extraneous applications (browsers, etc.). In the graphics, you can add and remove any resolutions and video cards as desired.
GameGPU
DirectX 12
At a resolution of 1920x1080 , the RAM consumption of the system by a video card with 6 gigabytes was 6200 megabytes, with 8 gigabytes 6400 megabytes , with 11 gigabytes 7100 megabytes.
At a resolution of 2560x1440 , the RAM consumption of the system by a video card with 6 gigabytes was 6400 megabytes, with 8 gigabytes 6500 megabytes , with 11 gigabytes 7100 megabytes.
At a resolution of 3840x2160 , the RAM consumption of the system by a video card with 6 gigabytes was 6500 megabytes, with 8 gigabytes 6500 megabytes , with 11 gigabytes 7100 megabytes.
RTX
At a resolution of 1920x1080 , the RAM consumption of the system by a video card with 6 gigabytes was 6300 megabytes, with 8 gigabytes 6500 megabytes , with 11 gigabytes 6900 megabytes.
At a resolution of 2560x1440 , the RAM consumption of the system by a video card with 6 gigabytes was 6400 megabytes, with 8 gigabytes 6600 megabytes , with 11 gigabytes 7000 megabytes.
At a resolution of 3840x2160 , the RAM consumption of the system by a video card with 6 gigabytes was 7900 megabytes, with 8 gigabytes 6600 megabytes , with 11 gigabytes 7000 megabytes.
| IRON SPONSORS |
 |
|
 |