


Horizon Forbidden West: Burning Shores: PC Performance Benchmarks for Graphics Cards and Processors
| BASIC GAME INFORMATION |

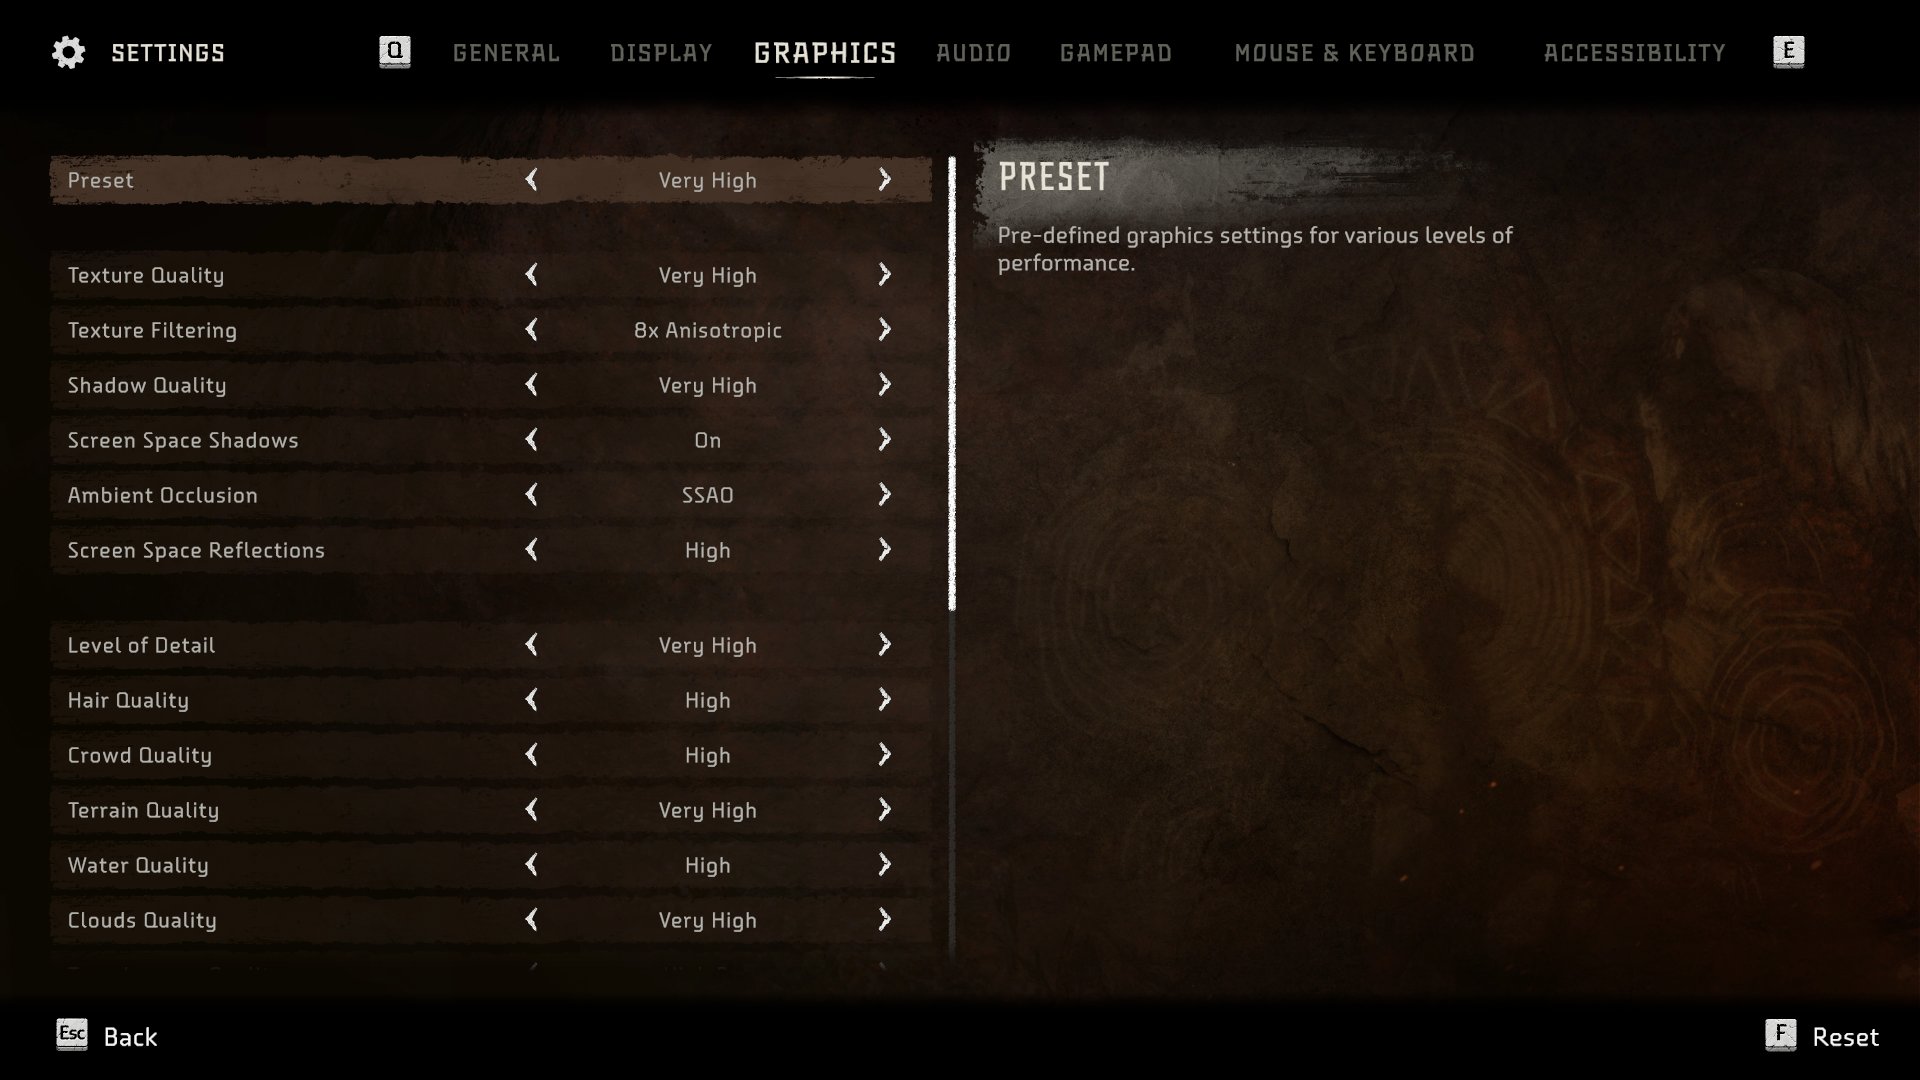
We tested Horizon Forbidden West: Burning Shores at the highest graphics settings using video cards from the latest GEFORCE RTX and RADEON RX series. During the tests, we also compared the performance and quality of graphic display when using native resolution and various upscaling technologies.
| THE GRAFICAL PART |
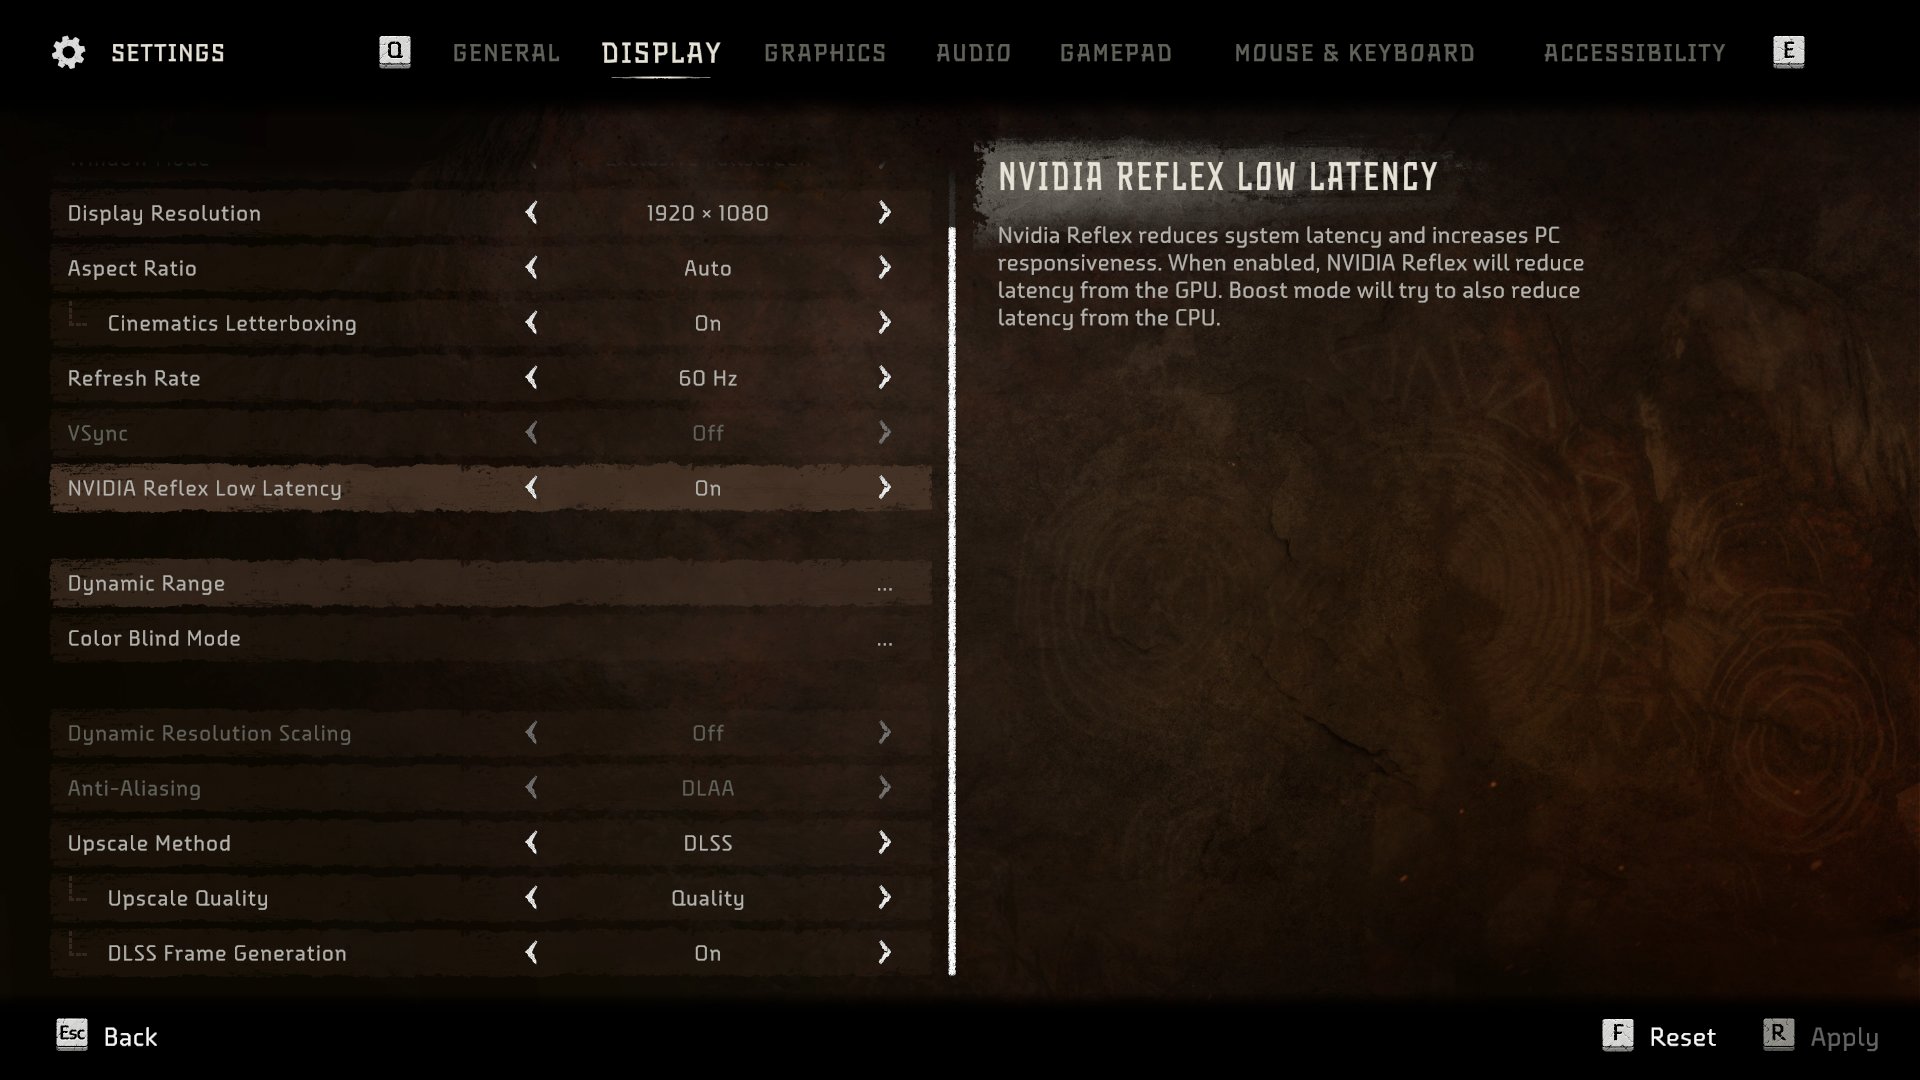
This subsection of our review highlights the main graphical aspects of this game. Particular attention is paid to the version of the graphics engine used, the version of the API used, graphic settings and the quality of development of the main visual aspects.
| SUPPORTED OS AND GRAPHICS API |
Horizon Forbidden West is supported on Windows 10/11.
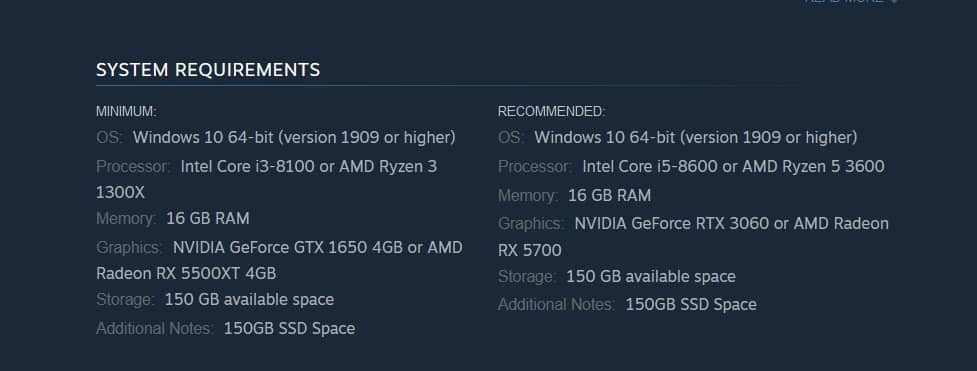
The preferred and primary graphics API for Horizon Forbidden West is DX12 .
| GAME ENGINE |
Horizon Forbidden West: Burning Shores is not just an expansion to the acclaimed game, but a significant step forward in terms of graphical innovation. This addition significantly improves the visual experience by leveraging advanced capabilities of the existing Decima engine developed by Guerrilla Games.
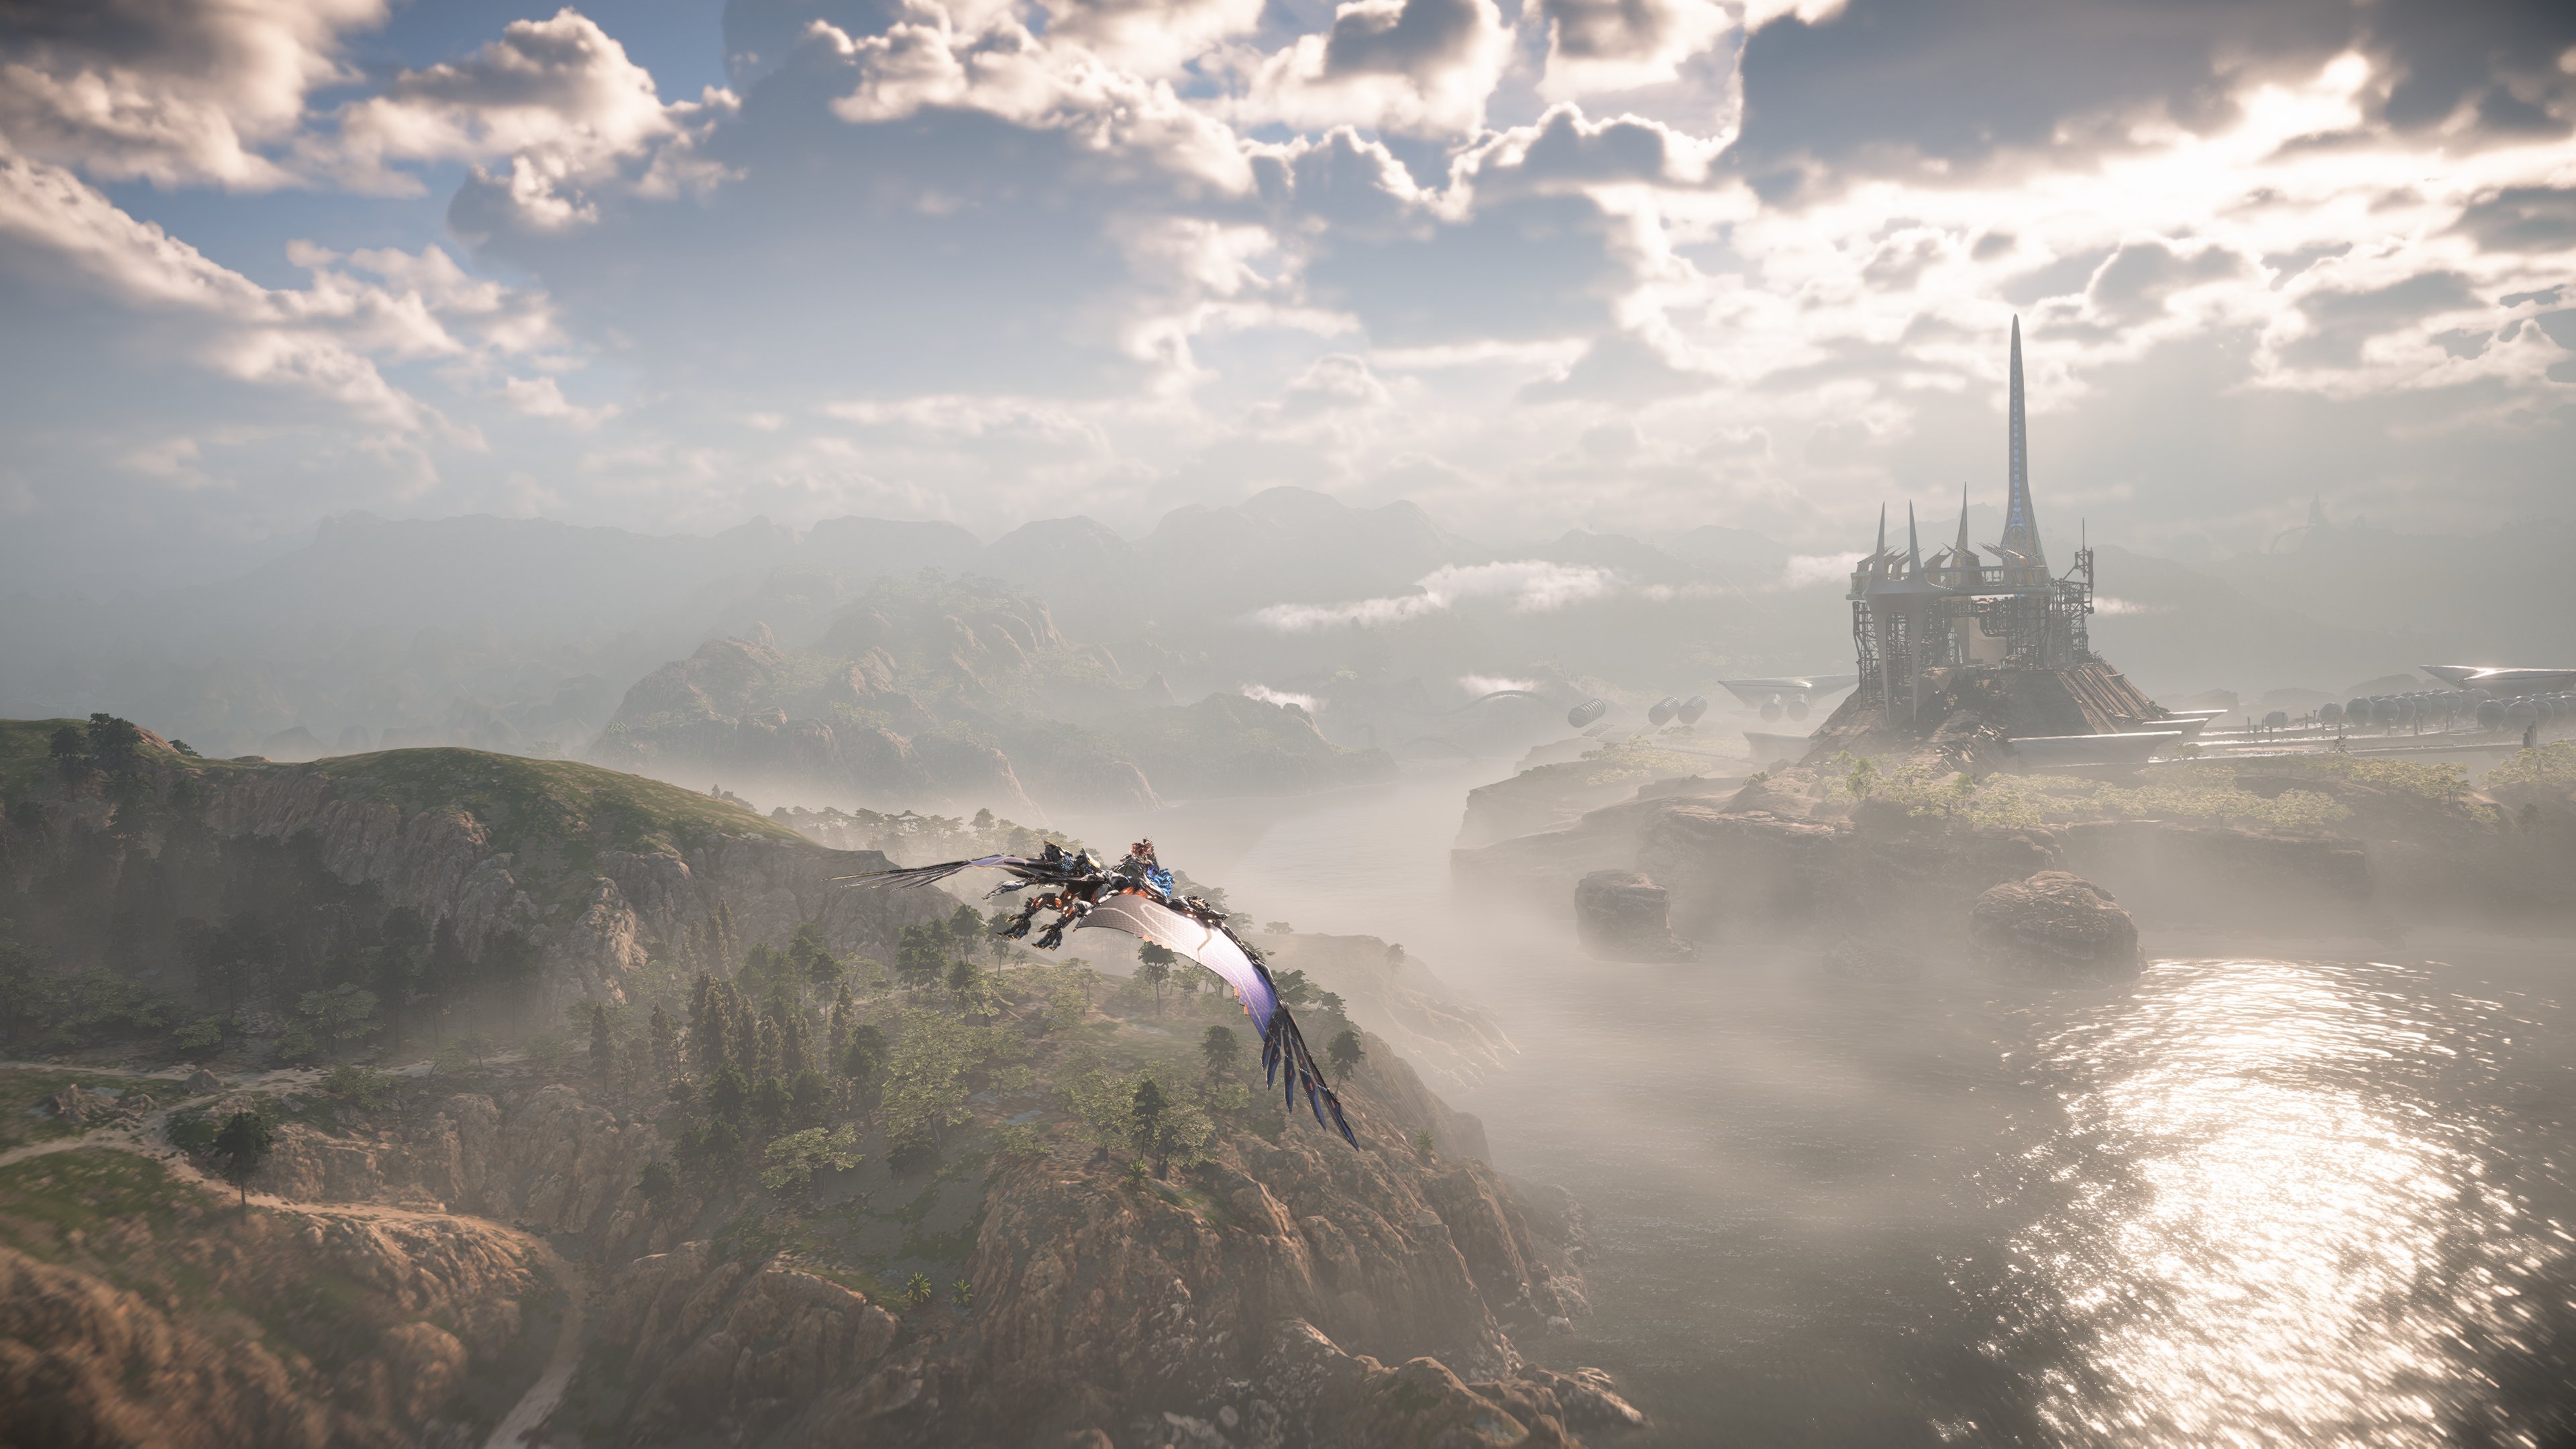
Enhancing Clouds and Skyscapes
One of the notable innovations in Burning Shores is an improved cloud display system. Clouds are now shaped using 3D voxel technology, allowing them to dynamically react to light and morph, creating a more realistic and impressive visual effect. These changes are especially noticeable when flying, where the player can observe vast and detailed clouds covering the sky over long distances.
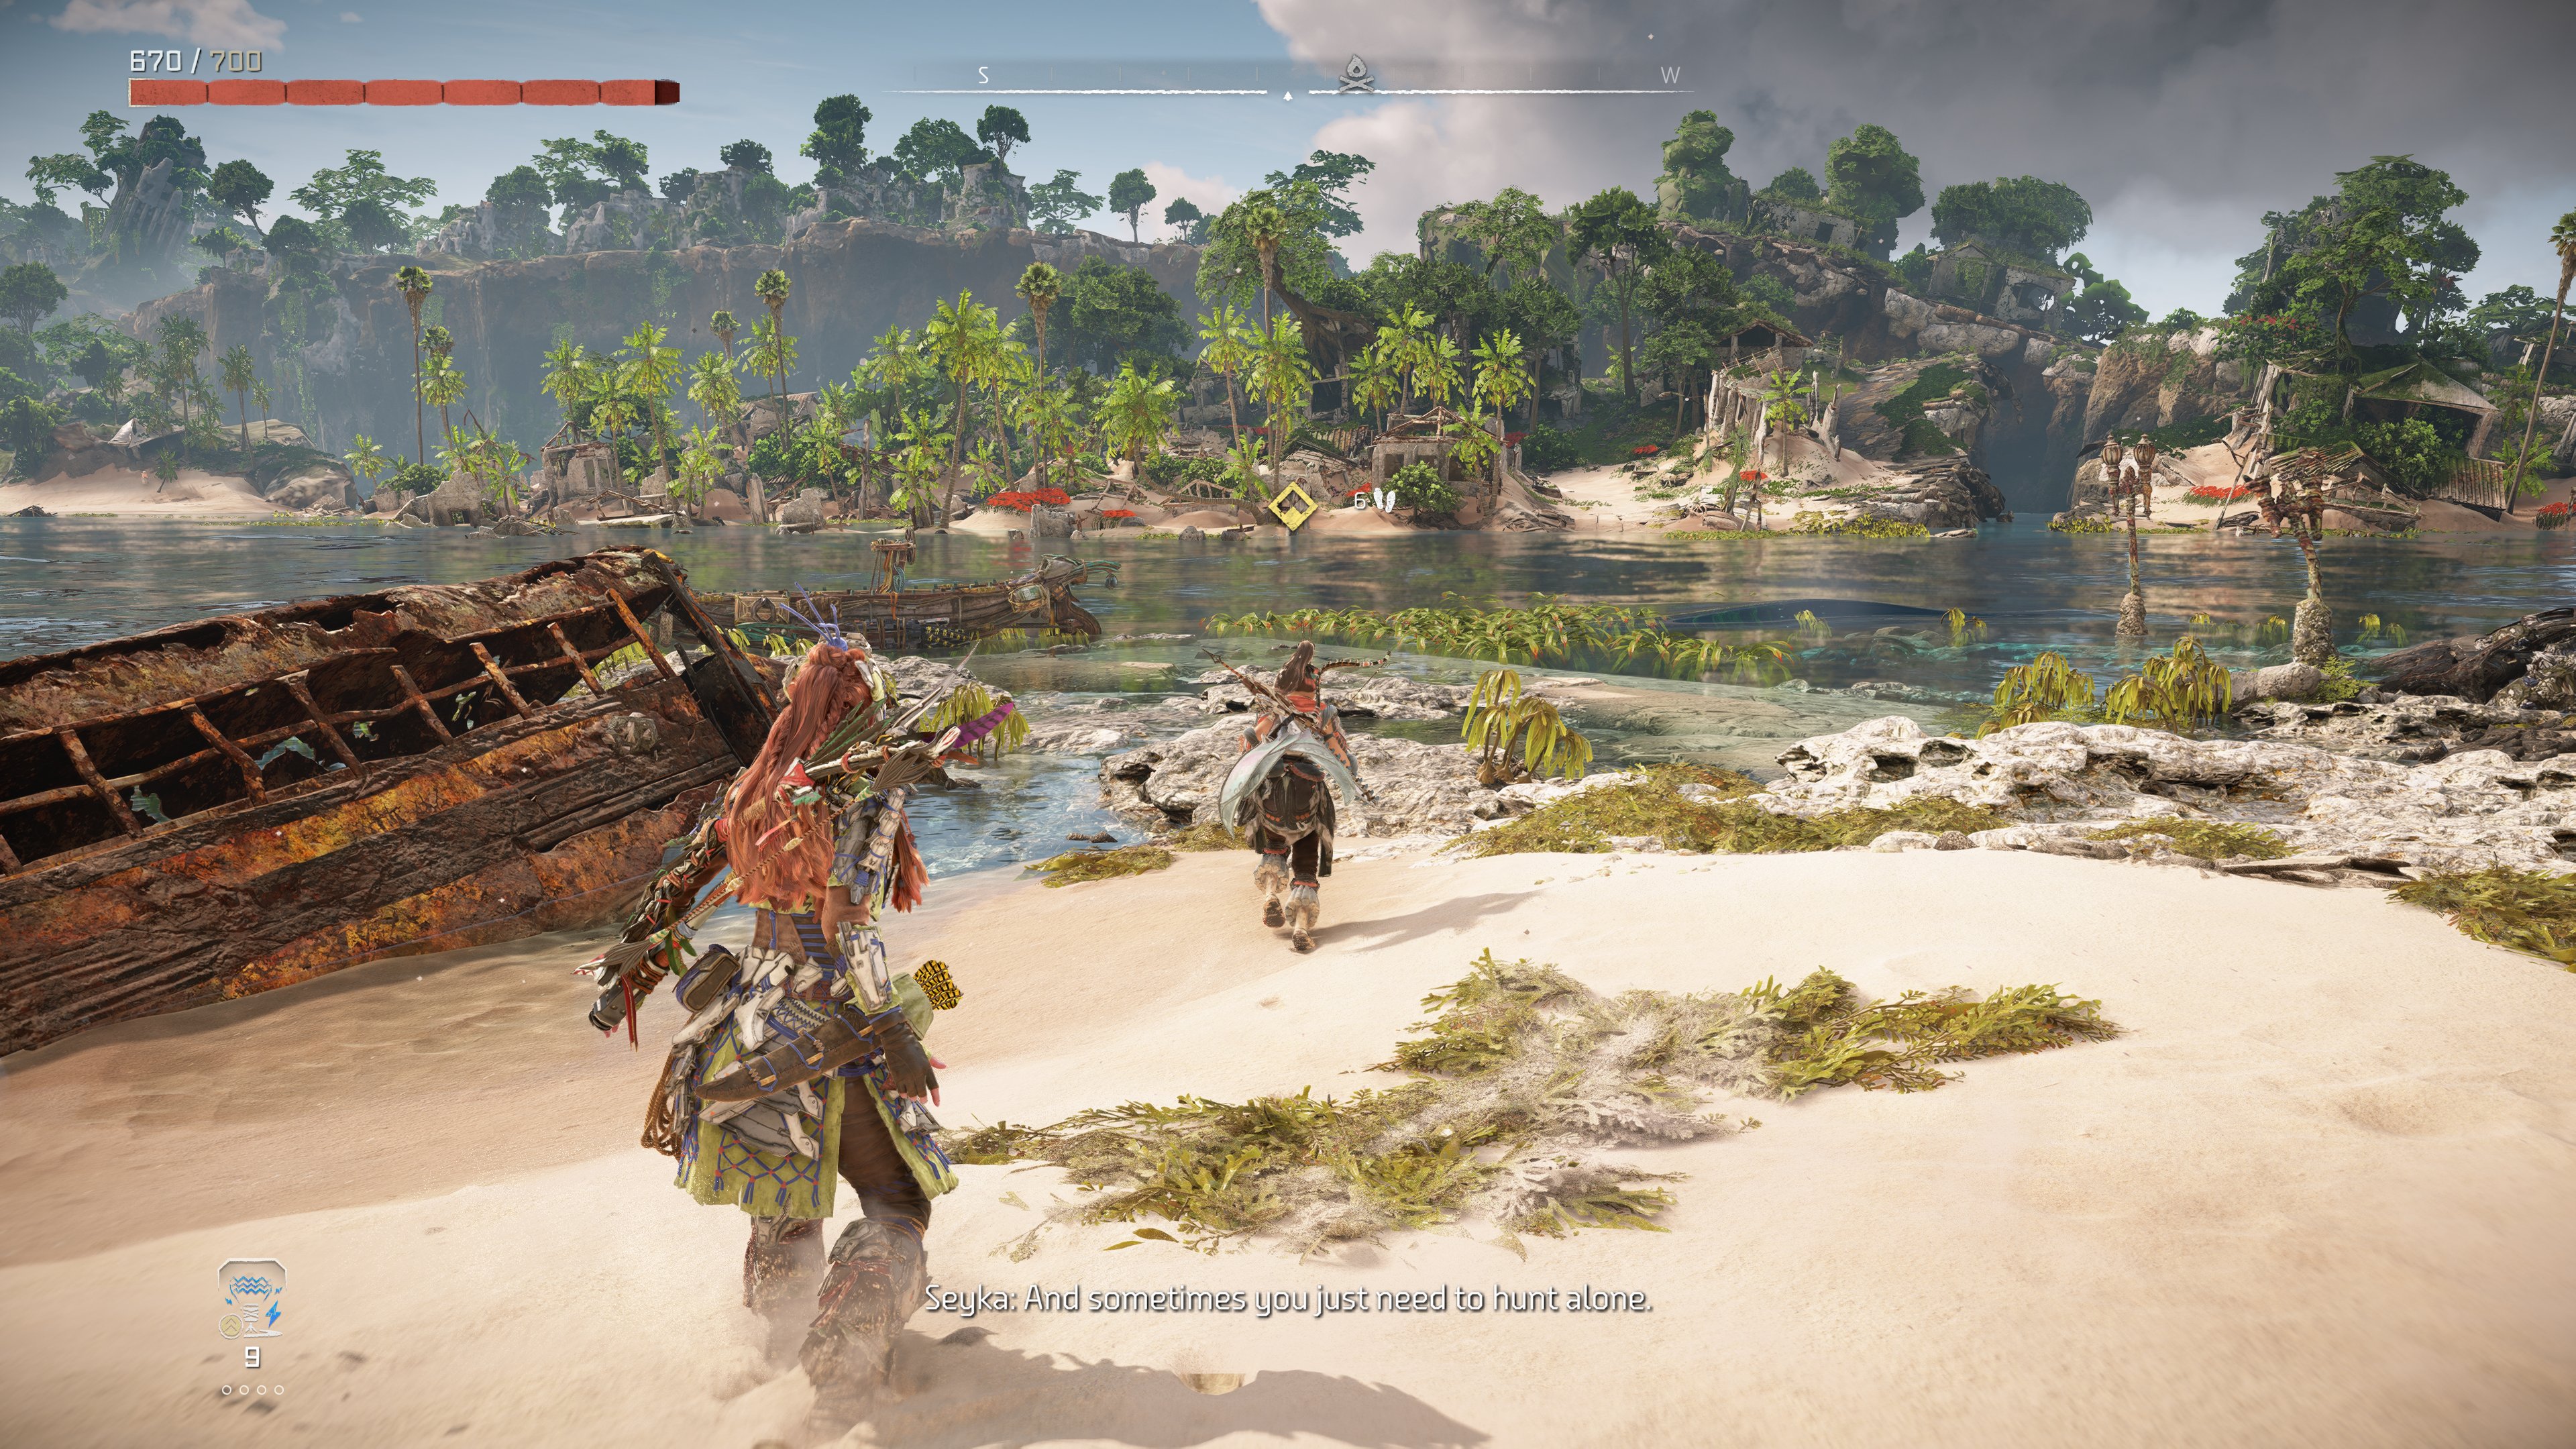
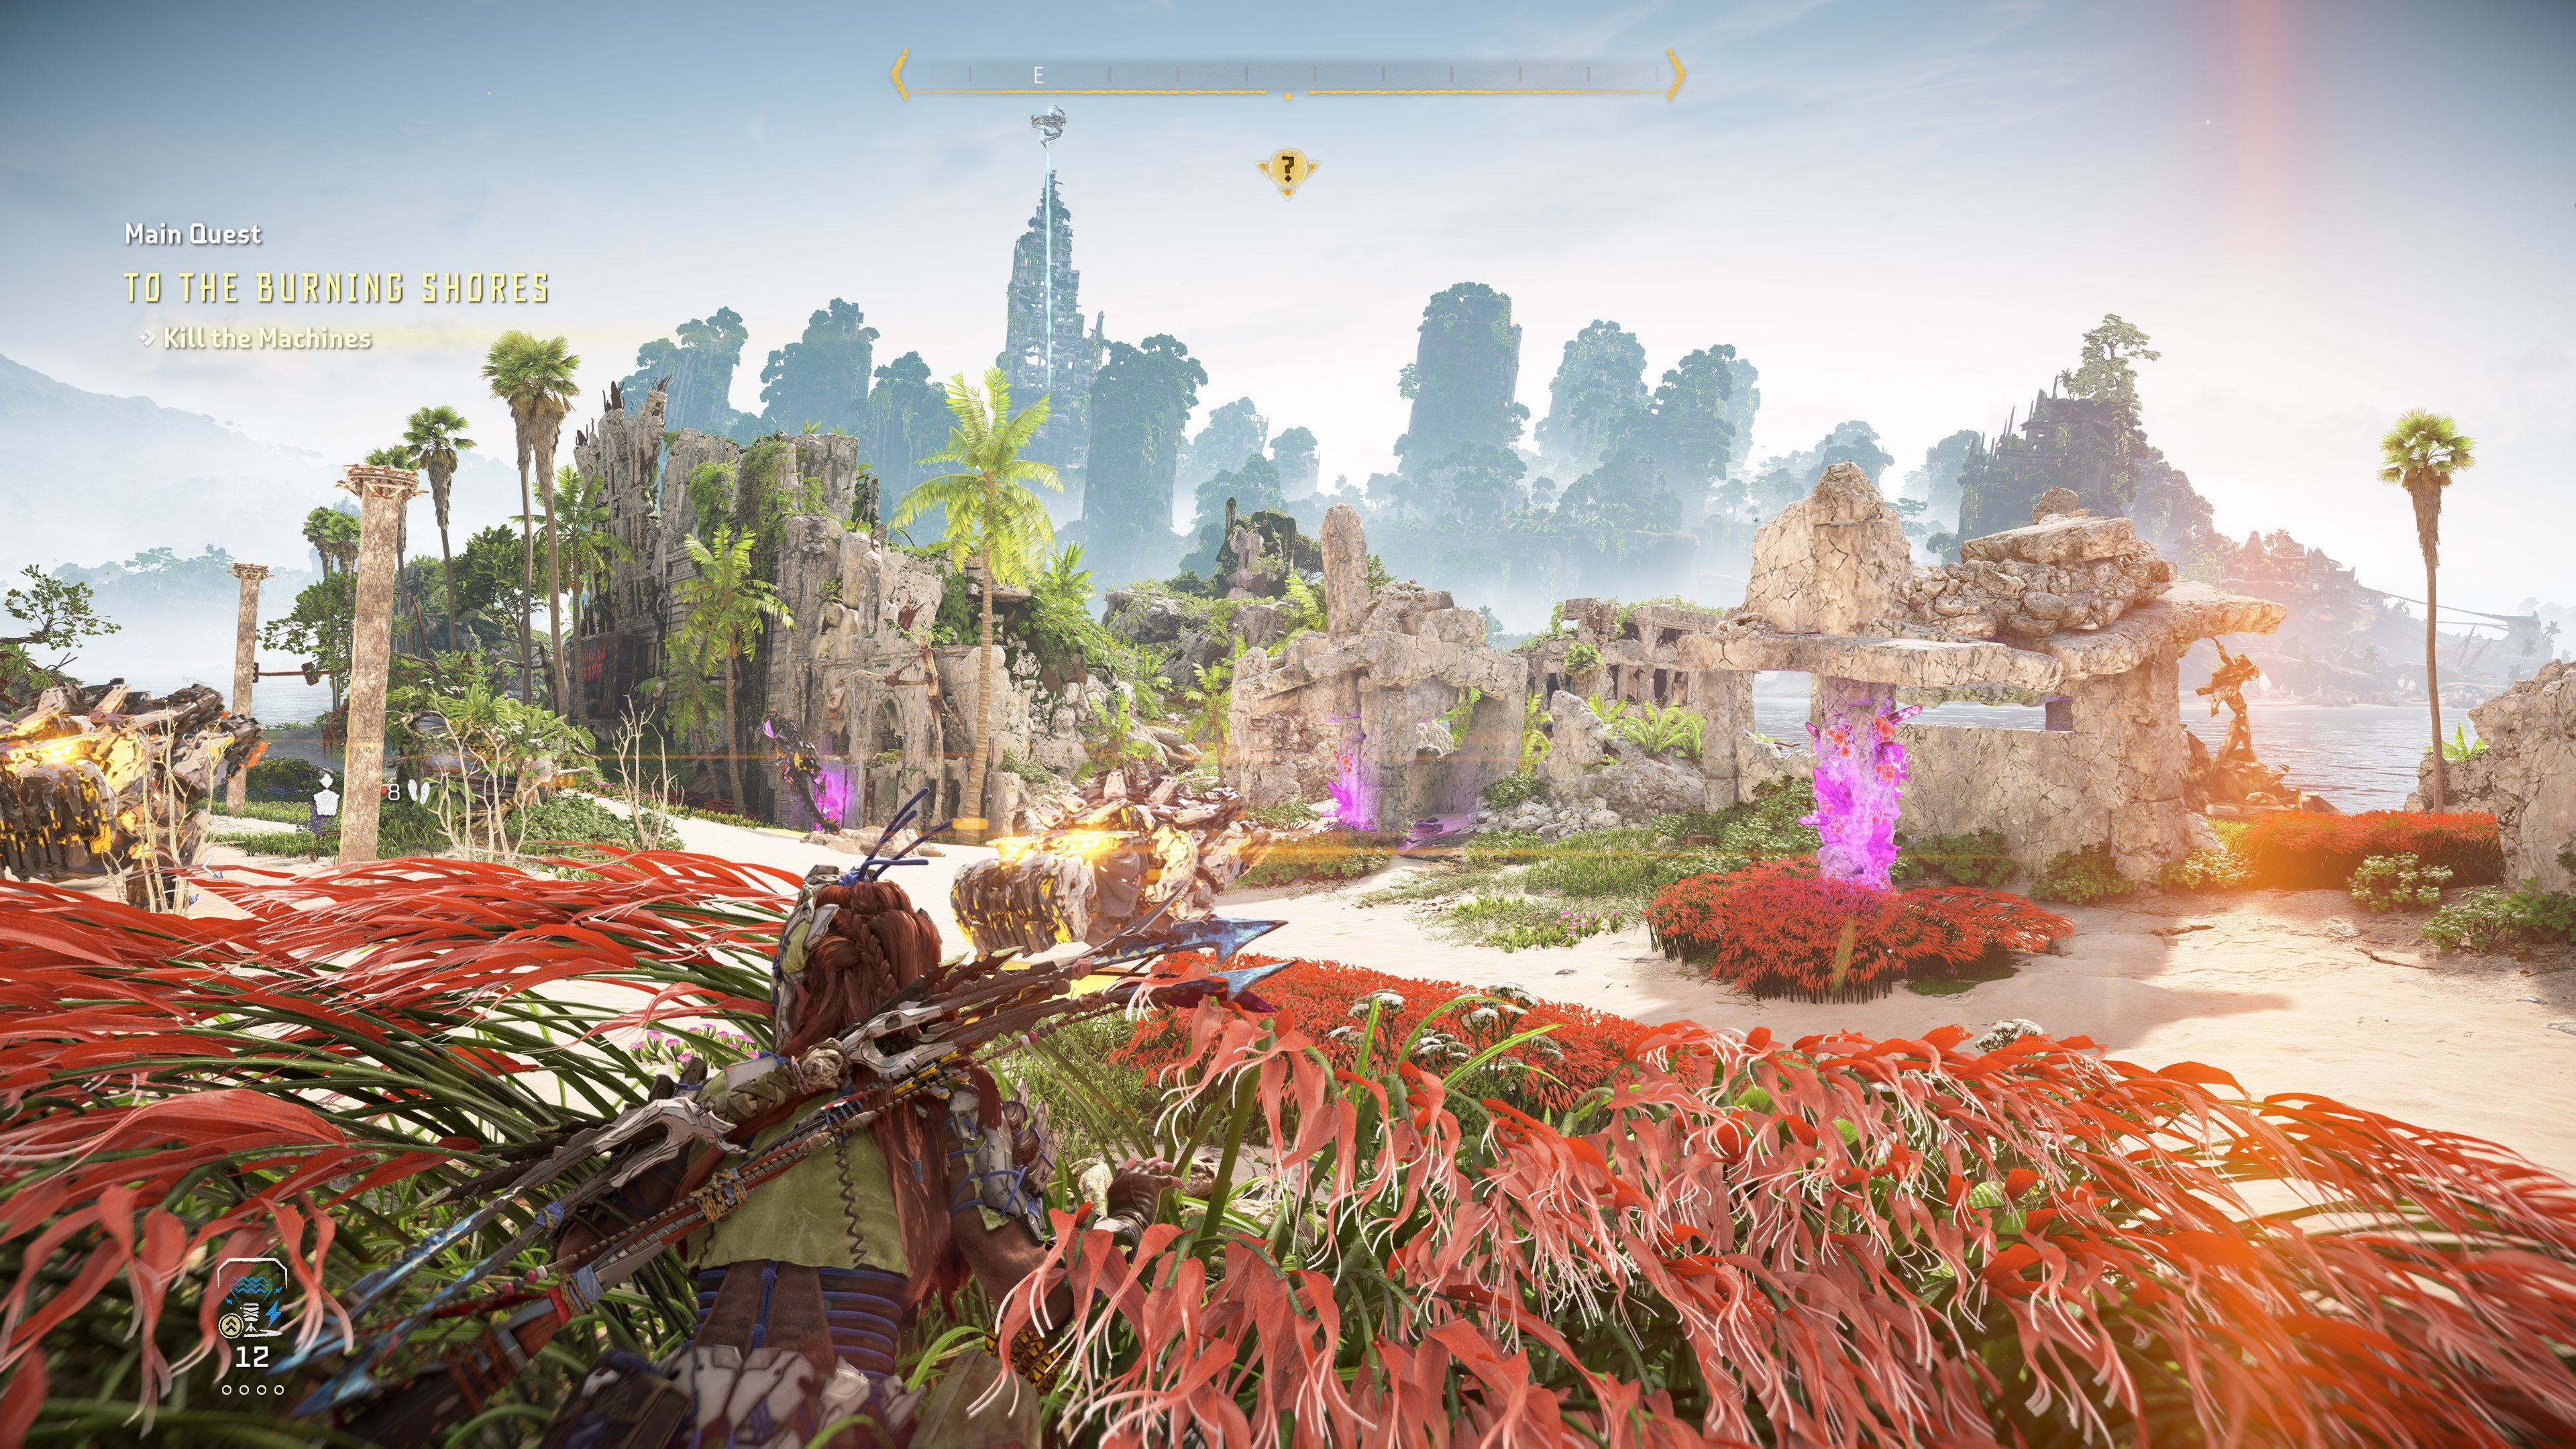
Increased detail of terrain and water surfaces
The game also shows significant improvements in geometry and texture detail. The new area, called Fleet's End, offers an impressive level of detail, visible in both the architecture and natural landscapes. Improvements have also been made to water surfaces, thanks to more powerful processing of water physics, which allows water to behave more naturally and realistically.

Performance improvements and optimizations
In terms of performance, Burning Shores focuses on optimization and efficiency. Despite the increased visual complexity, the developers managed to ensure stable game performance, minimizing delays and increasing the smoothness of the image. This provides not only a beautiful picture, but also a comfortable game without unwanted interruptions.

Overall, Horizon Forbidden West: Burning Shores demonstrated how technological improvements can transform the gaming experience, making it more immersive and visually exciting. Improvements in cloud rendering, scene detail, and performance open up new horizons for future projects in the video game industry.
| DIFFERENT QUALITY MODES |
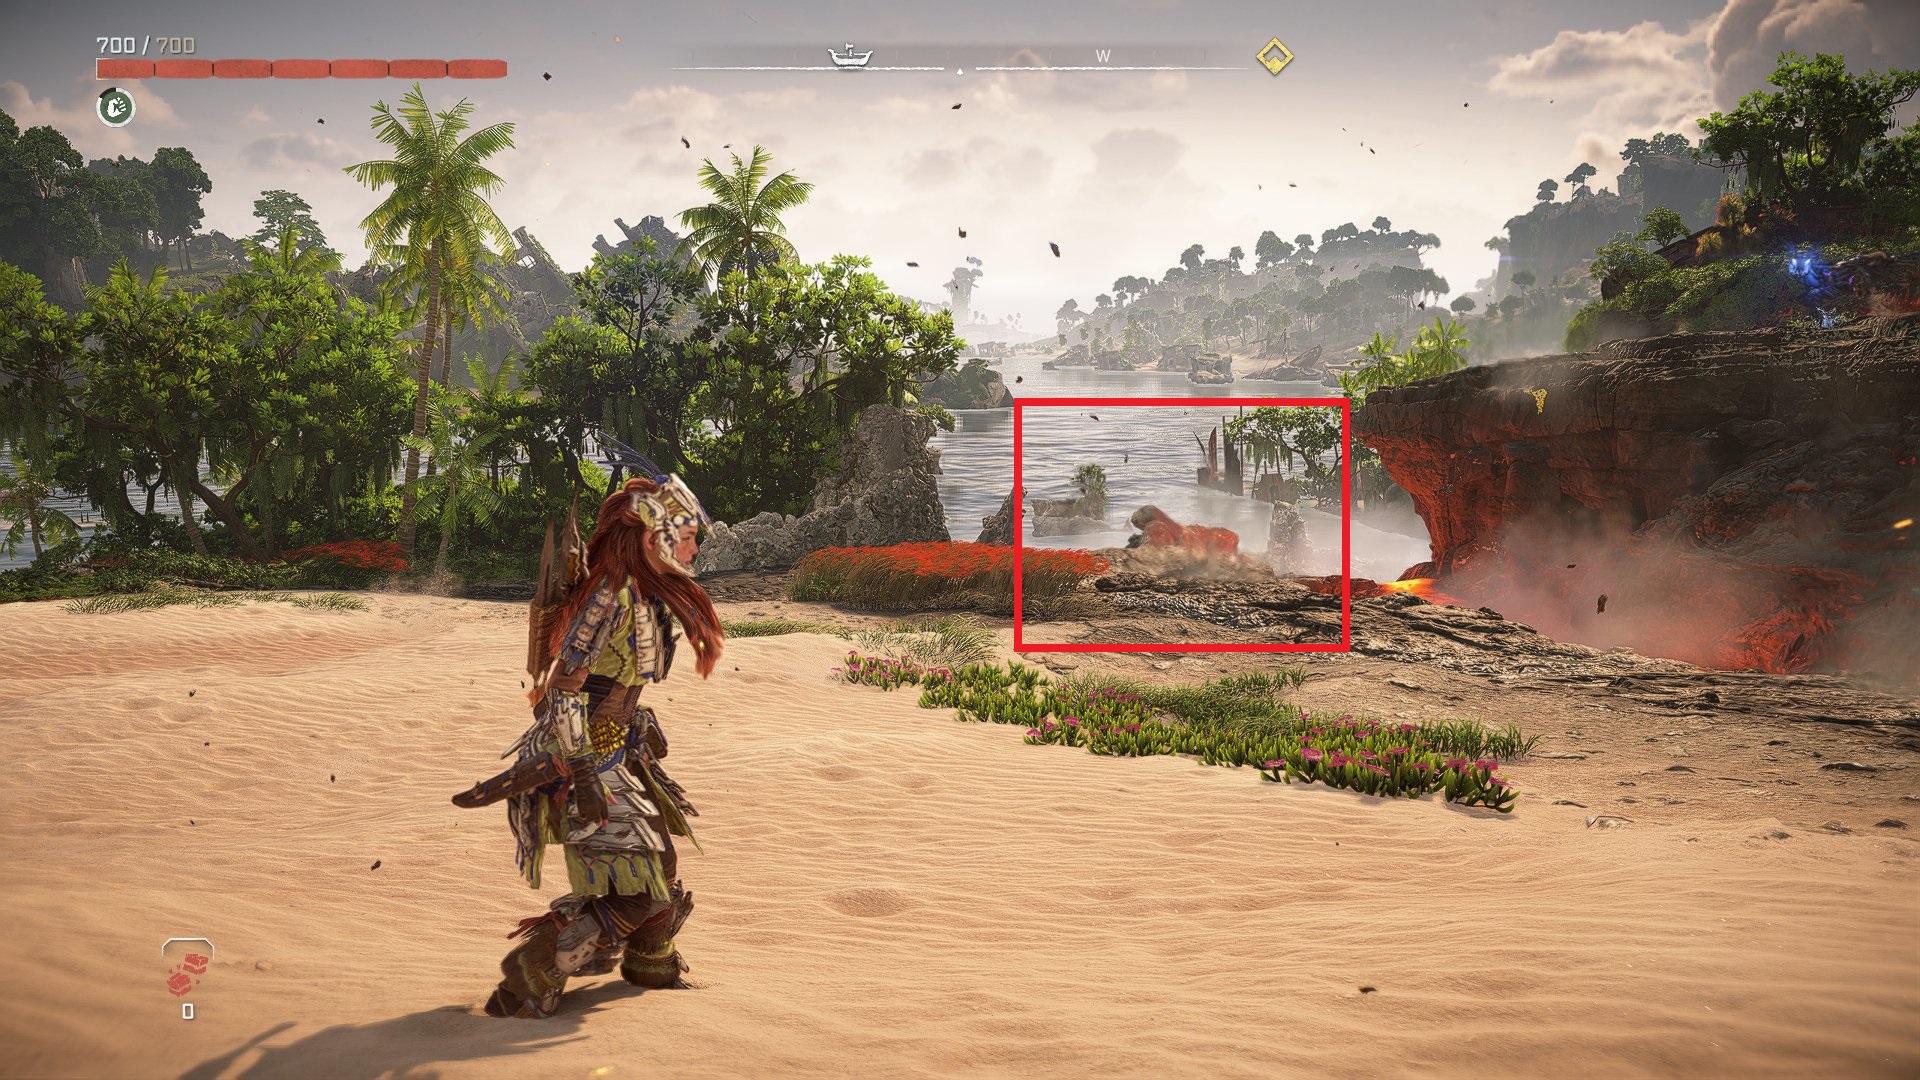
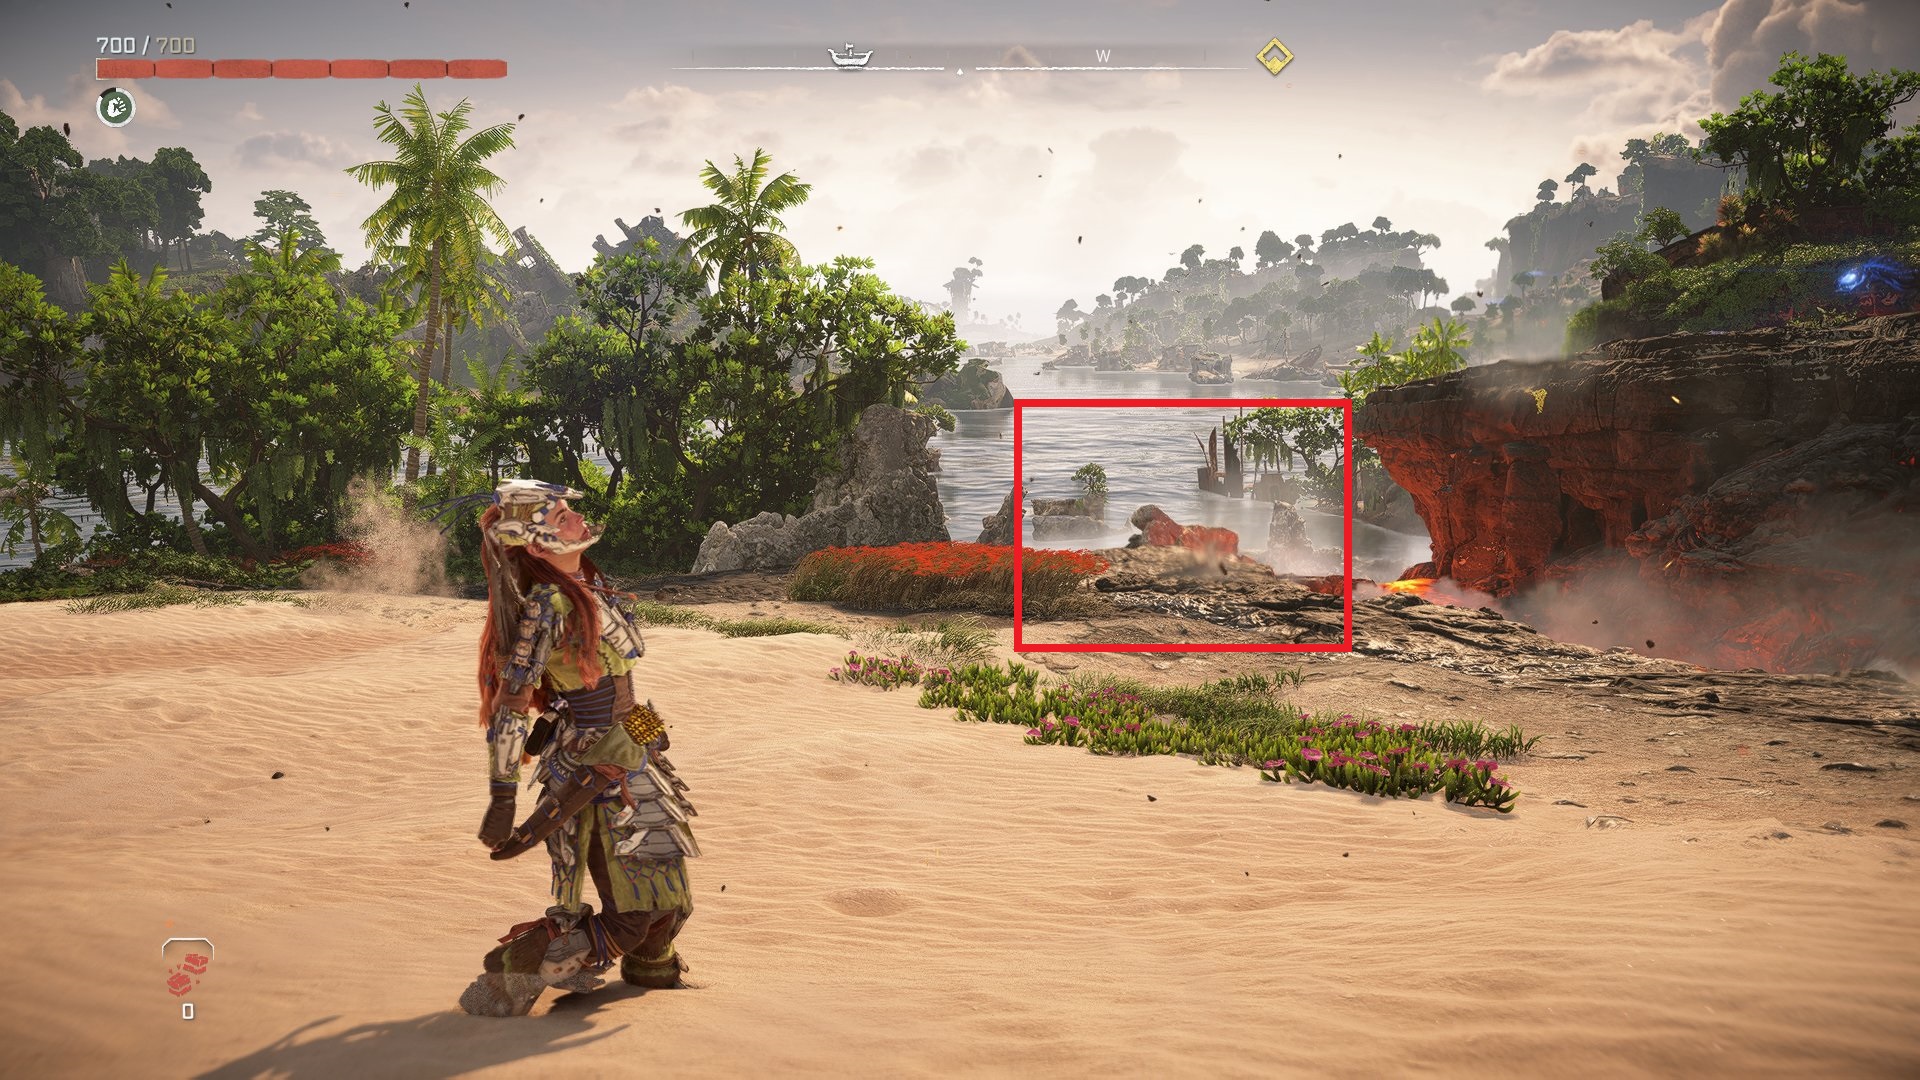
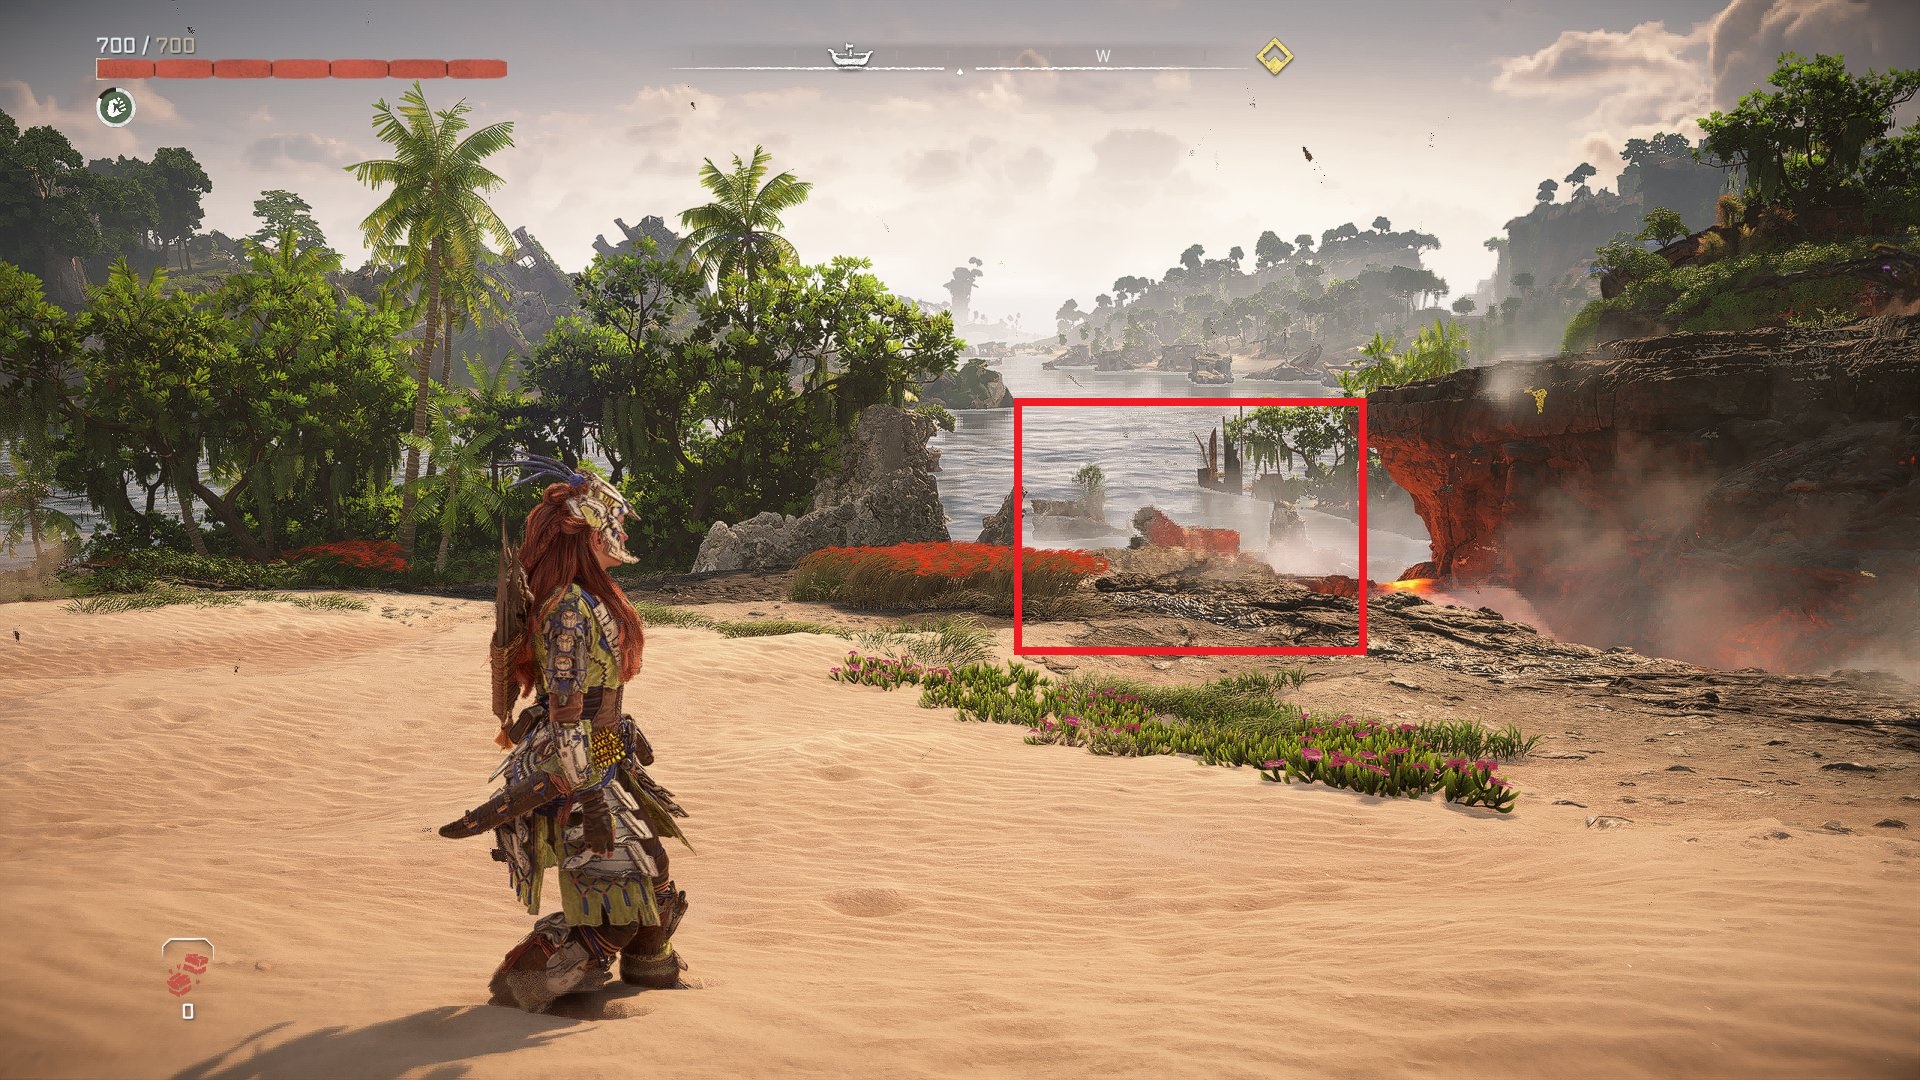
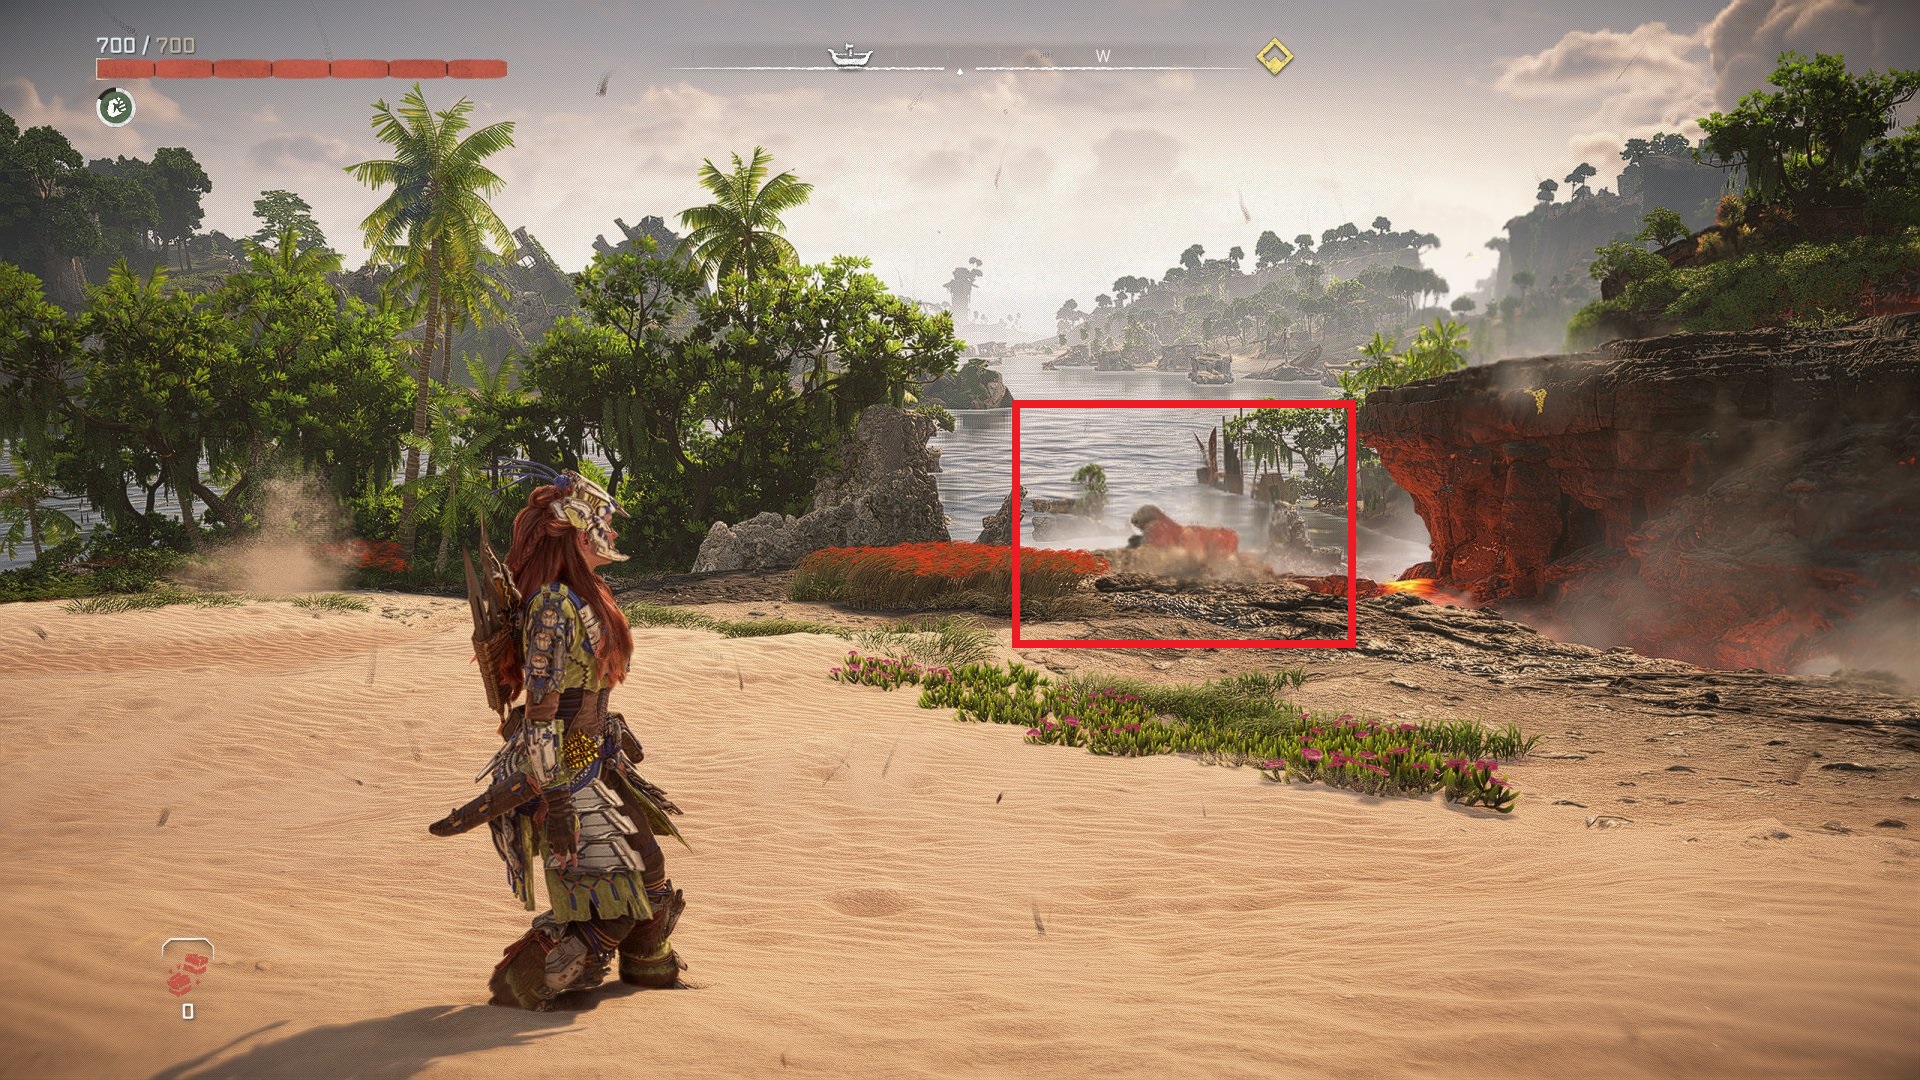
As we notice, in some aspects, the graphics enhancement in games does not reach the ideal quality, which leads to deterioration of the image. DLSS technology does a particularly good job, which significantly improves overall image clarity, although, as we can see, the quality of textures in the smoke leaves much to be desired compared to the original resolution. FSR performs the worst of all, generating a lot of artifacts. Intel XeSS technology performs better than FSR, but also faces the problem of artifacts.
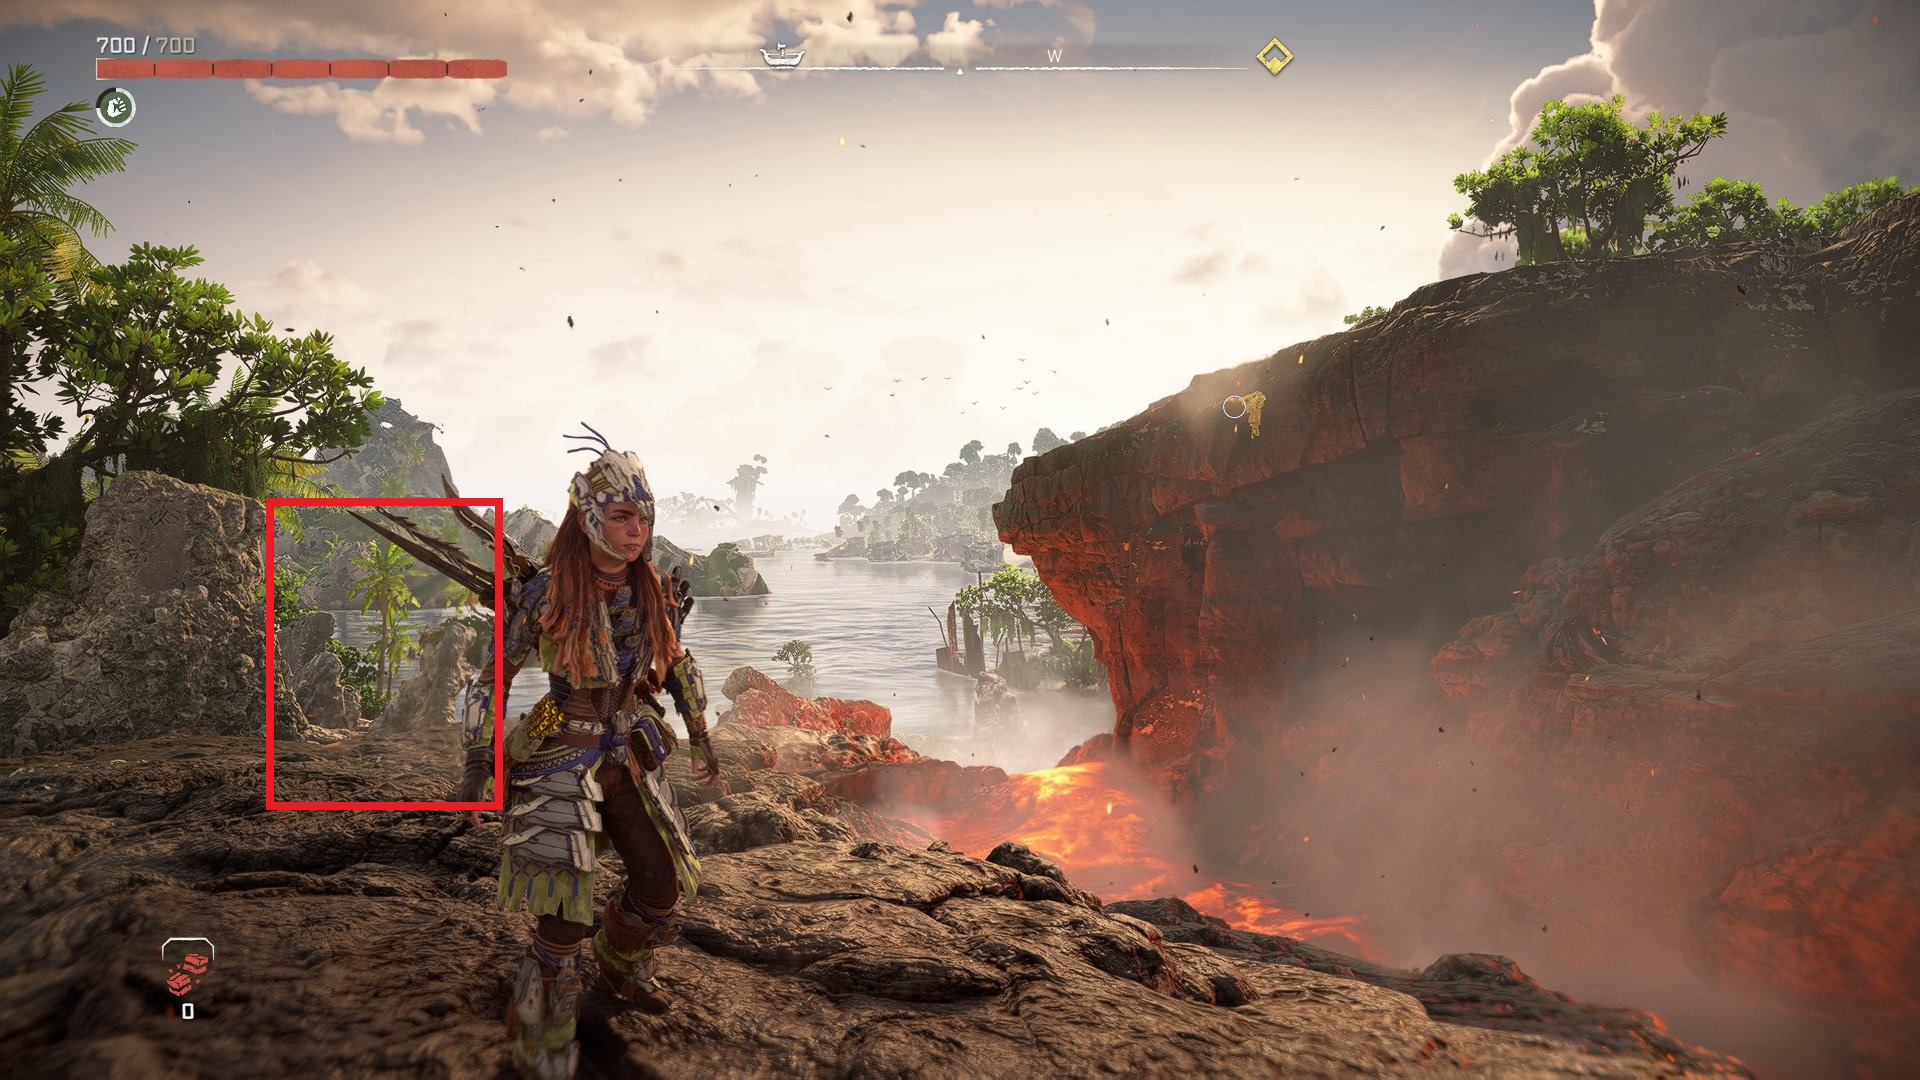
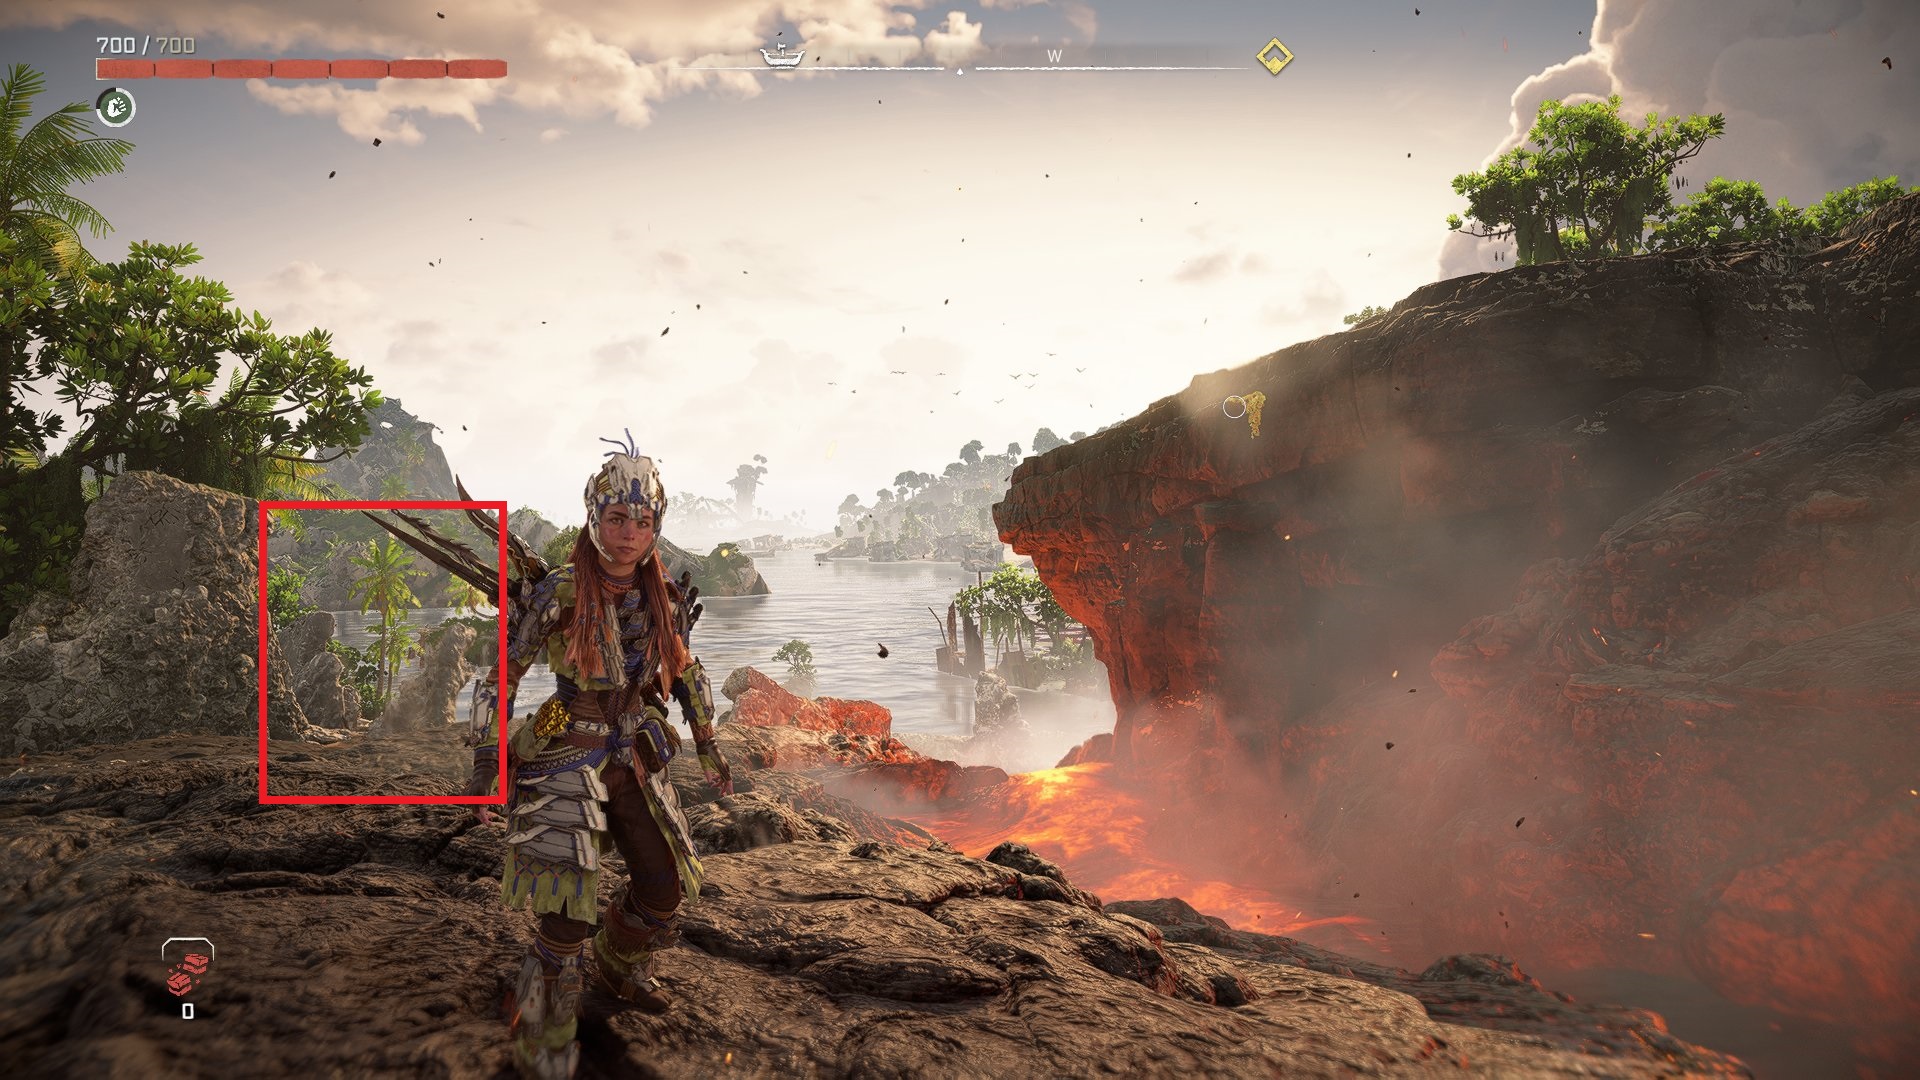
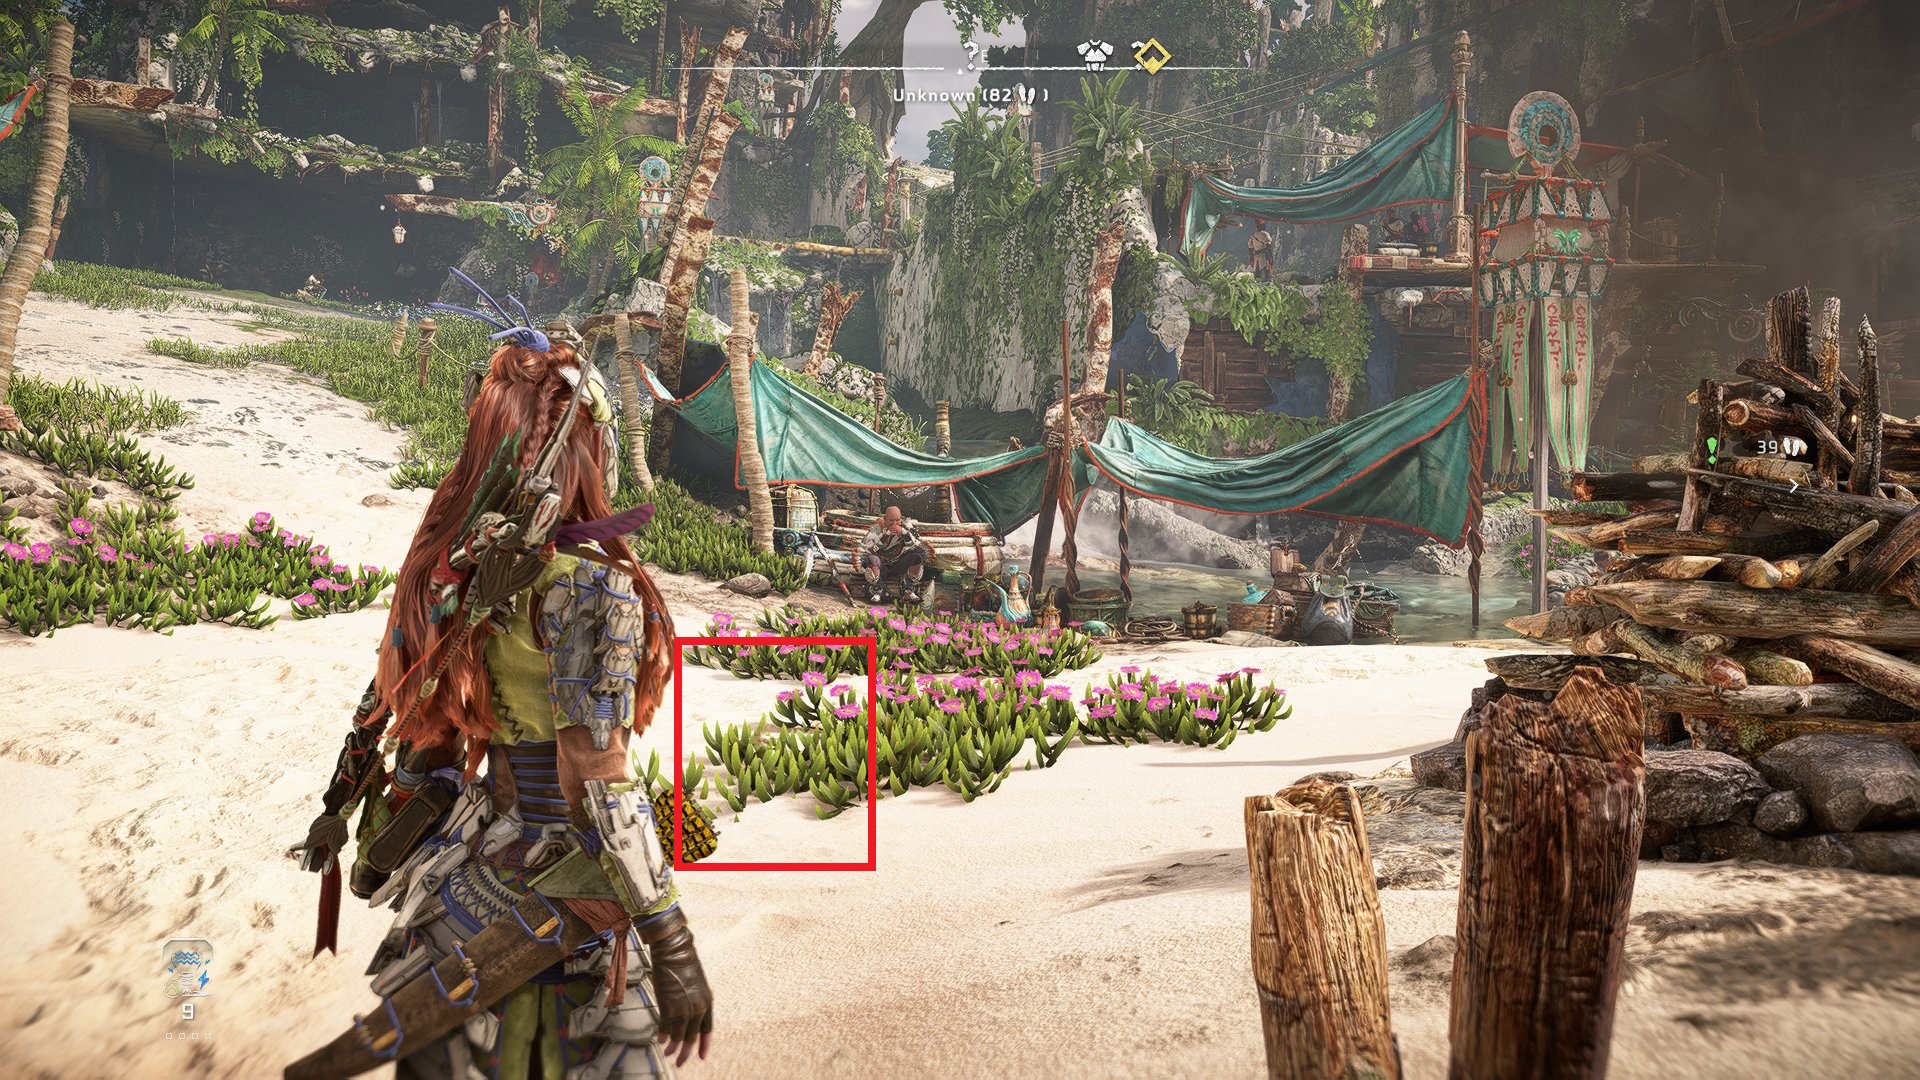
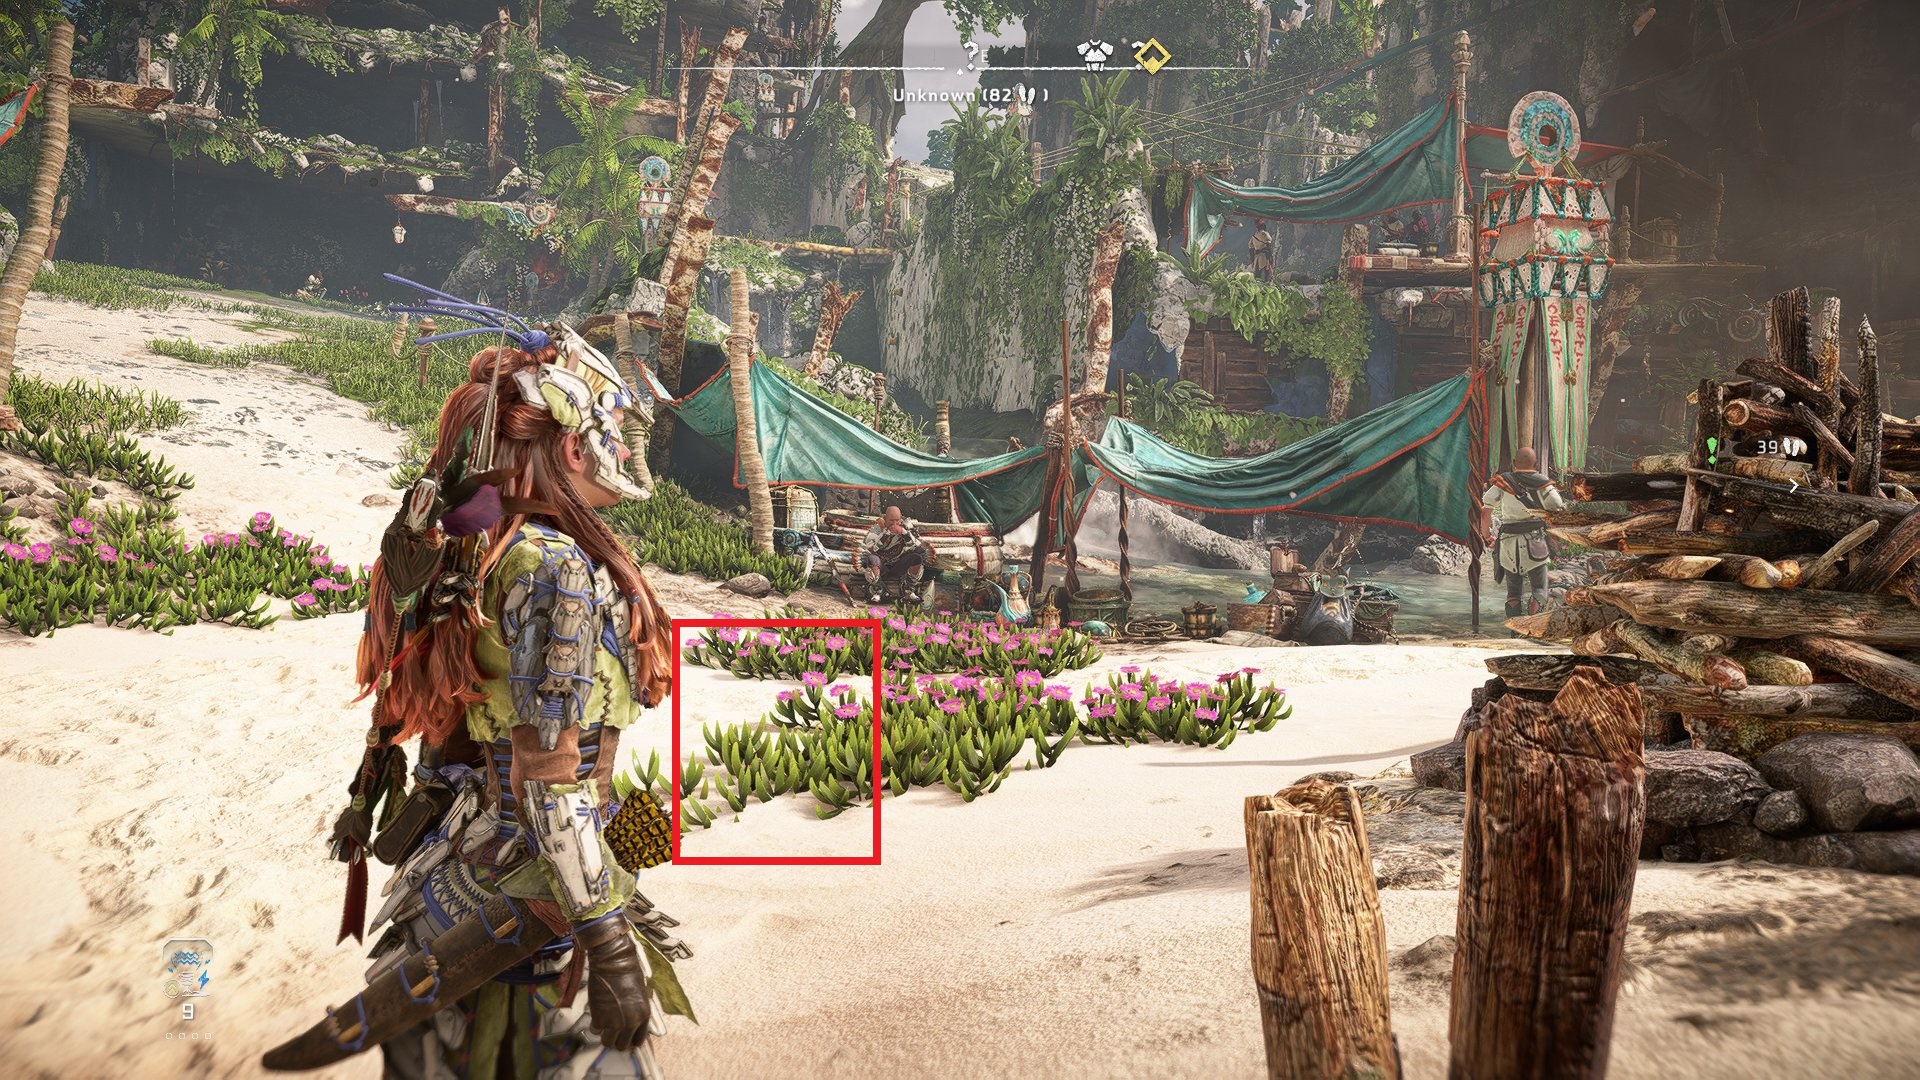
In the first screenshot, it is noticeable that when generating frames, foliage and water merge into one fuzzy texture, which makes the image somewhat cloudy. In the second screenshot, a “ghost flower” effect appears - an image of an element that theoretically should not be present in this scene.
In the case of Horizon Forbidden West: Burning Shores, it is better to give preference to using native resolution instead of using upscaling and frame generation technologies. Using native resolution provides a clearer, more accurate picture, making the gaming experience richer and more enjoyable to watch.
| TEST PART |
| Test configuration | |
| Test benches |
ROG Strix X570-E Gaming Z490 AORUS PRO AX GIGABYTE Z590 VISION GIGABYTE Z690 AERO G GIGABYTE Z790 GAMING X AX MSI MPG Z790 Edge WiFi ASUS ROG Strix B650-A Gaming WiFi ASUS ROG Maximus Z790 Apex Encore |
| Sponsored video cards |
ASUS ROG Strix GeForce RTX 4070 Ti OC ASUS TUF Gaming Radeon RX 7900 XT 20G Gigabyte GeForce RTX 4060 Ti GAMING OC |
| Multimedia equipment |
Monitor Philips 326M6VJRMB/00 Seasonic PRIME TX-1000 power supply 16 GB DDR4 4600 CL19 Kingston FURY Renegade 32 GB DDR4 3600 CL16 Kingston FURY Renegade 32 GB DDR4 4000 CL18 Kingston FURY Renegade 32 GB DDR5 5600 CL40 KingstonFURY Beast 32 GB DDR5 6000@6400 CL30 KingstonFURY Renegade 32 GB DDR5 7200@7600 CL36 KingstonFURY Renegade Kingston FURY Renegade PCIe 4.0 NVMe M.2 SSD MPG CORELIQUID K240 housing Case DeepCool CH510 WH SVO DeepCool LS720 WH |
| Software configuration |
|
| operating system | Windows 10 21H2/ Windows 11(Alder Lake) |
| Graphics driver |
Nvidia GeForce/ION Driver Release 552.12 WHQL AMD Software: Adrenalin Edition 24.3.1 |
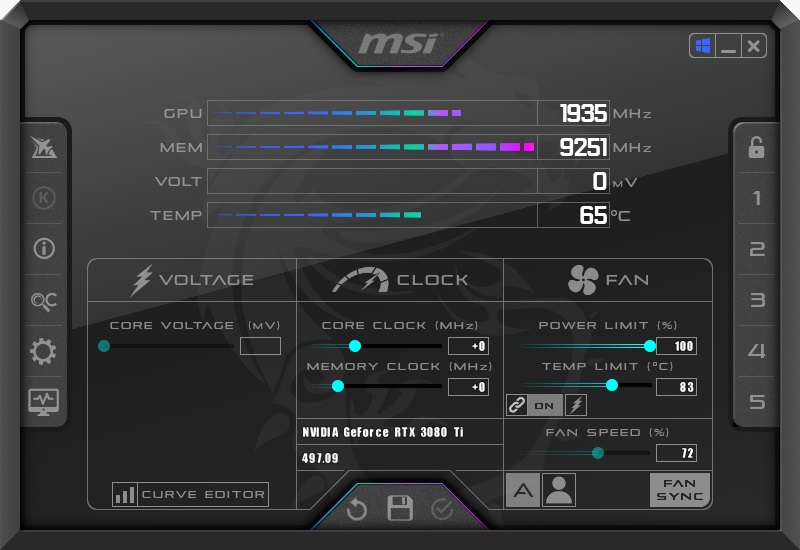
| Monitoring programs |
MSI Afterburner |
Our video cards were tested at resolutions of 1920x1080 , 2560x1440 and 3840x2160 with maximum graphics quality settings.
| GPU TEST |
In the video card test, the default resolution is 1920x1080; other resolutions are added and removed manually. You can also remove and add any positions of video cards. You can also select any of our test processors from the list in the drop-down menu, comparing its performance with the given video card tests (by default, the most productive solution is selected). The test is carried out on the most powerful CPU in this game and is scaled to other processors, taking into account their testing on NVIDIA and AMD video cards.

At a resolution of 1920x1080, an average FPS of 25 frames was shown by video cards of the Radeon RX 6600 or GeForce RTX 2060 level . A minimum FPS of at least 25 frames can be provided by video cards of the Radeon RX 6650 XT or GeForce RTX 2060 level . A comfortable average FPS of 60 frames can be provided by Radeon RX 6700 XT or GeForce RTX 2080 Ti solutions .
At a resolution of 1920x1080, an average FPS of 25 frames was shown by video cards of the Radeon RX 6600 XT or GeForce RTX 2060 level . A minimum FPS of at least 25 frames can be provided by video cards of the Radeon RX 6700 XT or GeForce RTX 3070 level . A comfortable average FPS of 60 frames can be provided by Radeon RX 6800 or GeForce RTX 4070 solutions .
At a resolution of 3840x2160, an average FPS of 25 frames was shown by video cards of the Radeon RX 6700 XT or GeForce RTX 2080 Ti level . A minimum FPS of at least 25 frames can be provided by video cards of the Radeon RX 6700 XT or GeForce RTX 2080 Ti level . A comfortable average FPS of 60 frames can be provided by Radeon RX 7900 XT or GeForce RTX 4080 .
Frame Generation
At a resolution of 1920x1080, an average FPS of 25 frames was shown by video cards of the GeForce RTX 4060 Ti level . A minimum FPS of at least 25 frames can be provided by video cards of the GeForce RTX 4060 Ti level . A comfortable average FPS of 60 frames can be provided by GeForce RTX 4060 Ti solutions .
At a resolution of 1920x1080, an average FPS of 25 frames was shown by video cards of the GeForce RTX 4060 Ti level . A minimum FPS of at least 25 frames can be provided by video cards of the GeForce RTX 4060 Ti level . A comfortable average FPS of 60 frames can be provided by GeForce RTX 4070 solutions .
At a resolution of 3840x2160, an average FPS of 25 frames was shown by video cards of the GeForce RTX 4060 Ti level . A minimum FPS of at least 25 frames can be provided by video cards of the GeForce RTX 4060 Ti level . A comfortable average FPS of 60 frames can be provided by GeForce RTX 4070 Ti solutions .
| VIDEO MEMORY CONSUMPTION |
Testing of video memory consumed by the game was carried out by MSI Afterburner. The indicator was based on results on video cards from AMD and NVIDIA at resolutions of 1920x1080, 2560x1440 and 3840x2160 with various anti-aliasing settings. By default, the graph displays the most current solutions. Other video cards are added and removed from the chart at the request of the reader.
GameGPU
At a resolution of 1920x1080, video memory consumption for video cards with 8 gigabytes is 7 gigabytes , with 12 gigabytes 10 gigabytes , with 16 gigabytes 10 gigabytes , with 24 gigabytes 10 gigabytes .
At a resolution of 2560x1440, video memory consumption for video cards with 8 gigabytes is 7 gigabytes, with 12 gigabytes 11 gigabytes , with 16 gigabytes 11 gigabytes , with 24 gigabytes 11 gigabytes .
At a resolution of 3840x2160, video memory consumption for video cards with 8 gigabytes is 7 gigabytes, with 12 gigabytes 12 gigabytes , with 16 gigabytes 12 gigabytes , with 24 gigabytes 12 gigabytes .
| CPU TEST |
Testing was carried out at a resolution of 1920x1080. In the processor test, you can remove or add any processor positions. You can also select any tested video card from the list in the drop-down menu, comparing its performance with the given processor test results (by default, the most productive solution from NVIDIA is selected). Testing takes place on the most powerful NVIDIA and AMD video cards and scales to low-end models.
When using NVIDIA video cards , Ryzen 3 3100 or Core i 3 10100 processors showed an acceptable rate of at least 25 frames per second , and solutions at the Ryzen 5 5600 or Core i 9 11900 level can provide an FPS rate of at least 60 frames per second .
When using AM D video cards , Ryzen 3 3100 or Core i 3 10100 processors showed an acceptable rate of at least 25 frames per second , and solutions at the Ryzen 5 5600 or Core i 9 11900 level can provide an FPS rate of at least 60 frames per second .
Frame Generation
When using NVIDIA video cards , Ryzen 3 3100 or Core i 3 10100 processors showed an acceptable rate of at least 25 frames per second , and solutions at the Ryzen 3 3100 or Core i 3 10100 level can provide an FPS rate of at least 60 frames per second .
GameGPU
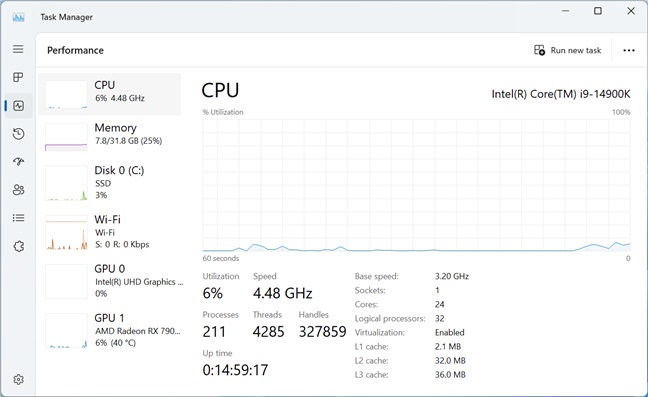
The game can load up to 24 streams. Uses up to 16 threads as efficiently as possible.
| RAM TEST |
The test was carried out on the basic configuration of Core i 9 13900K with 32 GB DDR5 6400 MHz pre-installed memory. All used RAM was taken as an indicator. The RAM test for the entire system was carried out on various video cards without launching third-party applications (browsers, etc.). In the graphics, you can add and remove any resolutions and video cards as desired.
GameGPU
At a resolution of 1920x1080, RAM consumption for video cards with 8 gigabytes is 15 gigabytes , with 12 gigabytes 10 gigabytes , with 16 gigabytes 11 gigabytes, with 24 gigabytes 12 gigabytes .
At a resolution of 2560x1440, RAM consumption for video cards with 8 gigabytes is 15 gigabytes , with 12 gigabytes 10 gigabytes , with 16 gigabytes 12 gigabytes , with 24 gigabytes 12 gigabytes .
At a resolution of 3840x2160, the RAM consumption for video cards with 8 gigabytes is 16 gigabytes , with 12 gigabytes 10 gigabytes , with 16 gigabytes 12 gigabytes , with 24 gigabytes 12 gigabytes .
| SPONSORS TESTS |
 |
 |
| |
 |
| |