f2 X icon 3 y2 steam2
 
 Search find 4120

Sandland: PC Performance Benchmarks for Graphics Cards and Processors

BASIC GAME INFORMATION

SANDLAND Win64 Shipping 2024 04 29 18 06 18 650

We tested Sandland at the highest graphics settings, on video cards from the GEFORCE RTX and RADEON RX series. Also, during the tests we conducted, we assessed the performance and quality of the graphic display of the game itself.

THE GRAFICAL PART

This subsection of our review highlights the main graphical aspects of this game. Particular attention is paid to the version of the graphics engine used, the version of the API used, graphic settings and the quality of development of the main visual aspects.

SUPPORTED OS AND GRAPHICS API

Sandland is supported by Windows 10/11.

steam

The priority and primary graphics API for Sandland is DX12 .

GAME ENGINE

Sandland game development history

Origin of ideas and start of the project

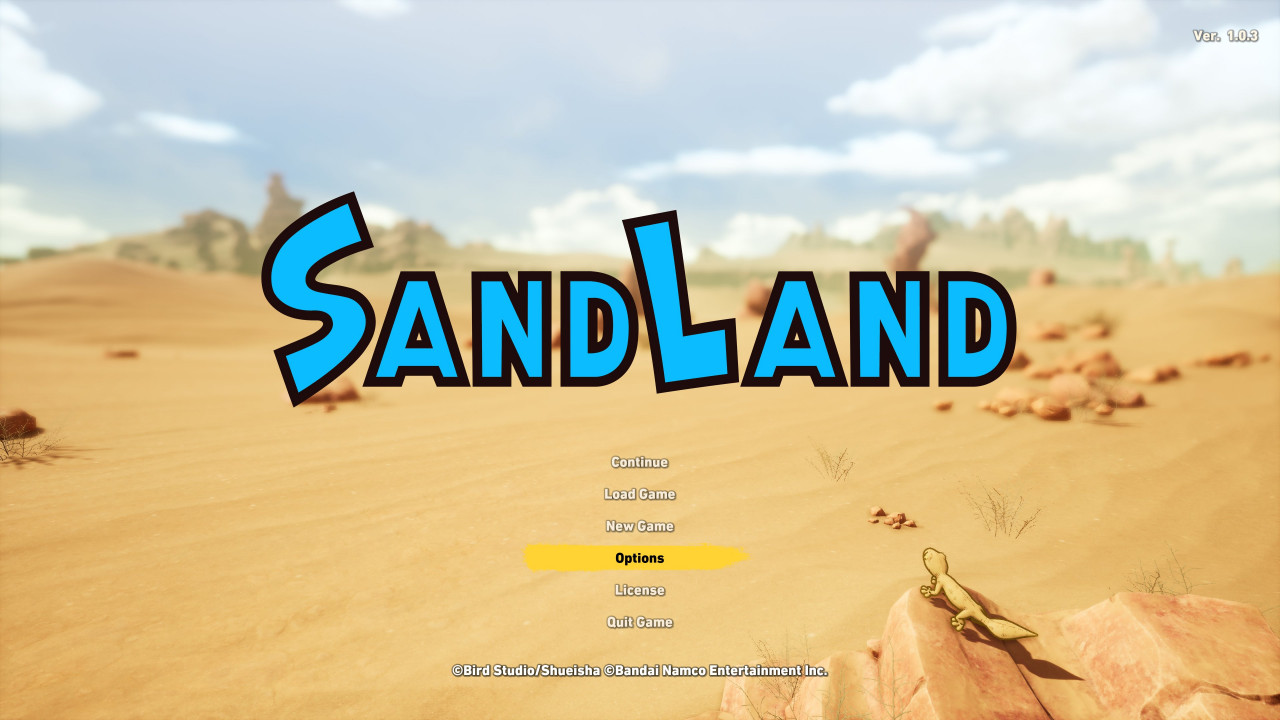
Sandland was developed by Bandai Namco and ILCA. This project is based on the manga "Sand Land" created by famous Japanese artist Akira Toriyama. The initiative to create the game came as part of a strategy to expand the media franchise, which included a manga, an animated series and, finally, a video game.

SANDLAND Win64 Shipping 2024 04 26 19 14 42 013

Development and problems

The development team included industry veterans who had previously worked on projects such as the One Piece games and the Pokemon remakes. Despite the team's experience, the project faced a number of challenges, including the high expectations of Toriyama's fans and technical limitations in recreating the manga's unique style in 3D space. However, the support of Toriyama himself, who was actively involved in the creative process, played a key role in overcoming these obstacles.

SANDLAND Win64 Shipping 2024 04 26 19 14 46 528

Launch and reception

Originally announced in 2023, the game was released in April 2024. It received mixed reviews, but many critics praised its fidelity to the source material and the quality of its gameplay.

Sandland graphics

Design and style

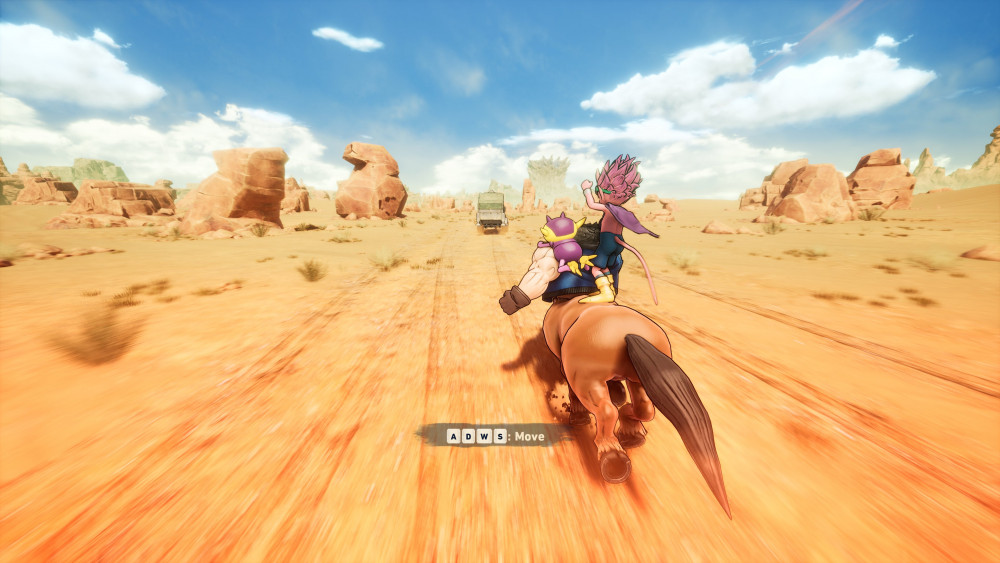
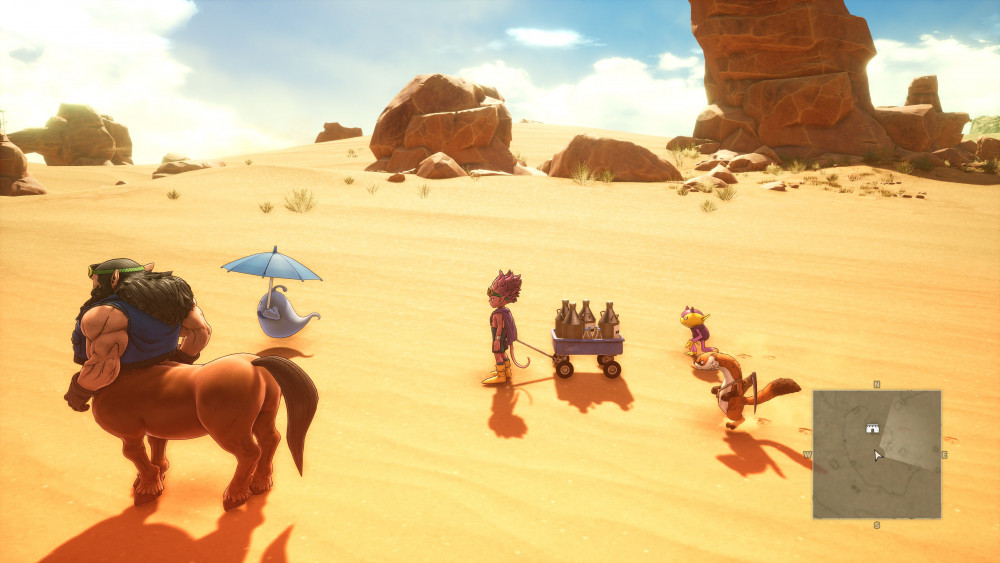
"Sandland" uses a cell shading style that is perfect for recreating the comic-like atmosphere of Toriyama's manga. The game's graphics feature a bright color palette and dynamic animations, which makes the game world lively and rich.

SANDLAND Win64 Shipping 2024 04 26 19 17 23 849

Technical implementation

The visual implementation of the game required the use of advanced technologies and close collaboration between designers and programmers. The developers focused on detailing the characters and the world, which allowed them to achieve a high level of visual appeal and depth of image.

Impact of graphics on gameplay

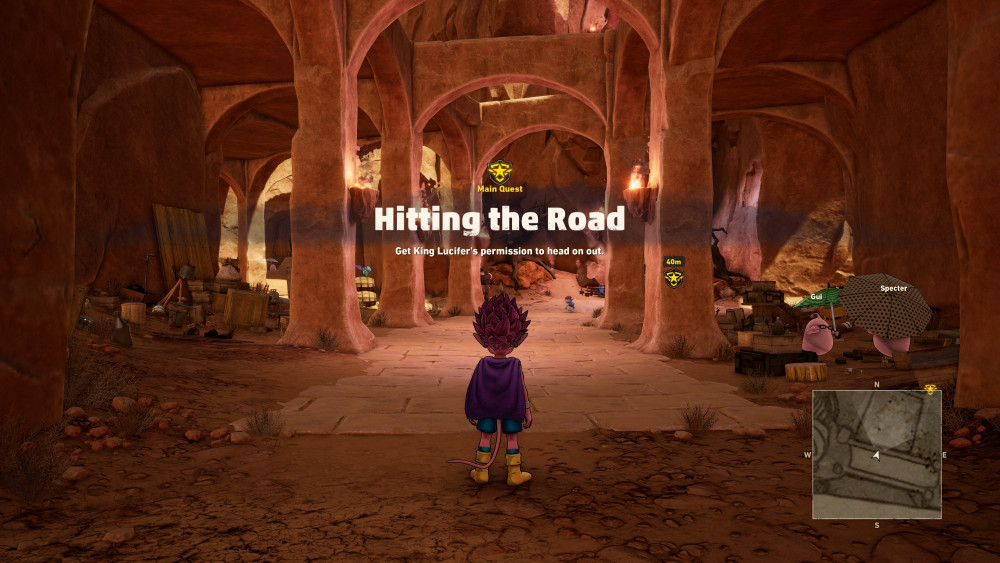
Sandland's high-quality graphics not only create an impressive visual style, but also enhance the gameplay experience, making action scenes exciting and emotionally rich.

Game engine Unreal Engine 4 and 5

Benefits of Unreal Engine 5

To develop "Sandland", the choice fell on Unreal Engine 5, the latest version of the popular game engine. This choice was driven by new features in UE5, including an improved Lumen lighting system and an innovative World Partition system that allows you to create more detailed and expansive game worlds without sacrificing performance .

SANDLAND Win64 Shipping 2024 04 26 19 18 07 505

Technical aspects and integration

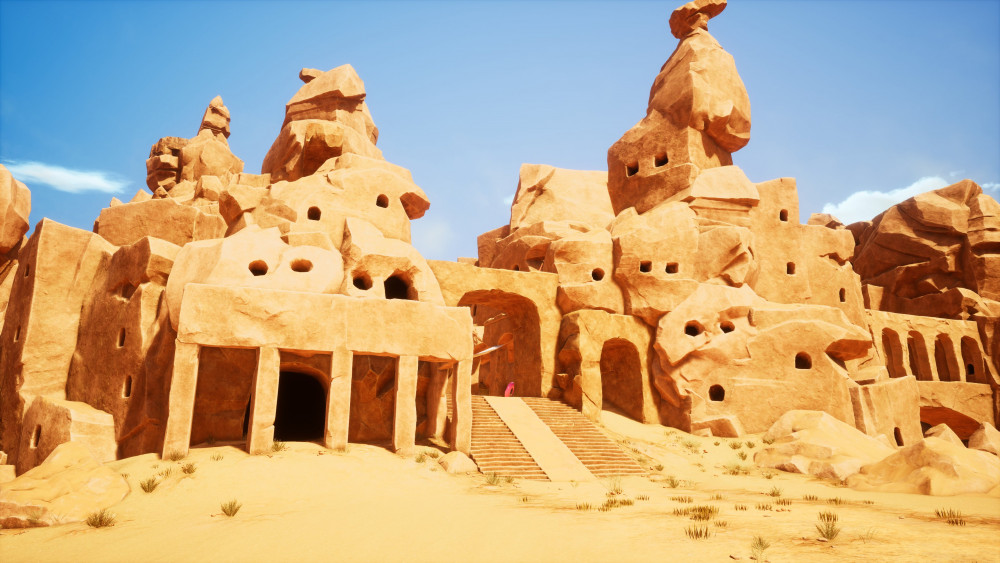
Unreal Engine 5 allowed developers to use high-poly models and complex textures, making the world of Sandland look impressively realistic. The Nanite system, which can render billions of polygons in real time, has given developers the ability to create stunning visuals and detailed scenarios .

SANDLAND Win64 Shipping 2024 04 26 19 23 03 778

From UE4 to UE5: selection and migration

The transition from Unreal Engine 4 to Unreal Engine 5 was a key decision that affected all aspects of development. UE5 provided additional tools and capabilities, especially in the areas of audio (MetaSounds) and animation (Control Rig), allowing for deeper and more immersive gaming experiences.

This transition also involved training and adaptation for the development team, as UE5 included new features and required a different approach to the design and programming of game mechanics. Despite initial difficulties, the results lived up to expectations, offering players a new level of interaction with the Sandland game world.

DIFFERENT QUALITY MODES

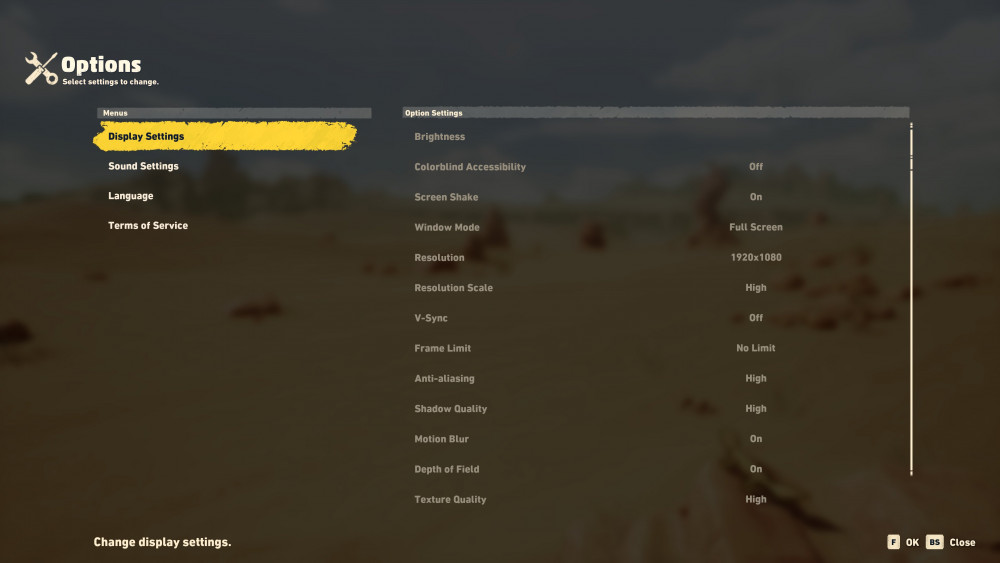
In-game graphics settings at minimum reduce the level of detail and disable various graphics functions to improve performance, while settings at maximum enable all possible effects, providing the highest quality and detail of the image.

TEST PART
Test configuration
Test benches

ROG Strix X570-E Gaming

Z490 AORUS PRO AX       

GIGABYTE Z590 VISION   

GIGABYTE Z690 AERO G  

GIGABYTE Z790 GAMING X AX

MSI MPG Z790 Edge WiFi

ASUS ROG Strix B650-A Gaming WiFi 

ASUS ROG Maximus Z790 Apex Encore

Sponsored video cards


ASUS ROG Strix GeForce RTX 4070 Ti OC

ASUS TUF Gaming Radeon RX 7900 XT 20G

Gigabyte GeForce RTX 4060 Ti GAMING OC

Multimedia equipment

Monitor Philips 326M6VJRMB/00

Power supply ASUS TUF Gaming 750W Gold PSU

16 GB DDR4 4600 CL19 Kingston FURY Renegade

32 GB DDR4 3600 CL16 Kingston FURY Renegade             

32 GB DDR4 4000 CL18 Kingston FURY Renegade             

32 GB DDR5 5600 CL40 KingstonFURY Beast                      

32 GB DDR5 6000@6400 CL30 KingstonFURY Renegade

32 GB DDR5 7200@7600 CL36 KingstonFURY Renegade

Kingston FURY Renegade PCIe 4.0 NVMe M.2 SSD           

MPG CORELIQUID K240 housing 

Case DeepCool CH510 WH 

SVO DeepCool LS720 WH

Software configuration
operating system Windows 10 21H2/ Windows 11(Alder Lake)
Graphics driver

Nvidia GeForce/ION Driver Release 552.22 WHQL

AMD Software: Adrenalin Edition 24.4.1

Monitoring programs

MSI Afterburner

 
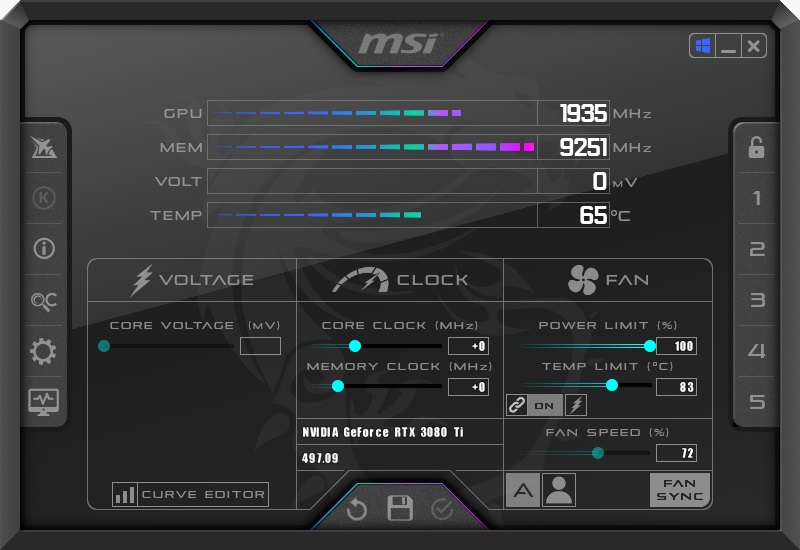
All video cards were tested at maximum graphics quality using MSI Afterburner. The purpose of the test is to determine how video cards from different manufacturers behave under the same conditions. Below is a video of the test segment:

 Our video cards were tested at resolutions of 1920x1080 , 2560x1440 and 3840x2160 with maximum graphics quality settings.

GPU TEST

SANDLAND Win64 Shipping 2024 04 29 18 06 22 153 

In the video card test, the default resolution is 1920x1080; other resolutions are added and removed manually. You can also remove and add any positions of video cards. You can also select any of our test processors from the list in the drop-down menu, comparing its performance with the given video card tests (by default, the most productive solution is selected). The test is carried out on the most powerful CPU in this game and is scaled to other processors, taking into account their testing on NVIDIA and AMD video cards.

Sandland: Test GPU
  • Max
  • Screen resolutions 1 out of 3

  • Hide DLSS/FSR video cards

  • Loading...

 At a resolution of 1920x1080, an average FPS of 25 frames was shown by video cards of the Radeon RX 6600 or GeForce RTX 2060 level .  A minimum FPS of at least 25 frames can be provided by video cards of the Radeon RX 6600 or GeForce RTX 2060 level . A comfortable average FPS of 60 frames can be provided by Radeon RX 6600 or GeForce RTX 2060 solutions .

At a resolution of 1920x1080, an average FPS of 25 frames was shown by video cards of the Radeon RX 6600 or GeForce RTX 2060 level .  A minimum FPS of at least 25 frames can be provided by video cards of the Radeon RX 6600 or GeForce RTX 2060 level . A comfortable average FPS of 60 frames can be provided by Radeon RX 6700 or GeForce RTX 2060 solutions .

At a resolution of  3840x2160,  an average FPS of 25 frames was shown by video cards of the Radeon RX 6600 XT or GeForce RTX 2060 level .  A minimum FPS of at least 25 frames can be provided by video cards of the Radeon RX 6650 or GeForce RTX 2060 level . A comfortable average FPS of 60 frames can be provided by Radeon RX 6800 or GeForce RTX 3070 solutions .

VIDEO MEMORY CONSUMPTION

aft

Testing of video memory consumed by the game was carried out by  MSI Afterburner. The indicator was based on results on video cards from AMD and NVIDIA at resolutions of  1920x1080, 2560x1440 and 3840x2160 with various anti-aliasing settings. By default, the graph displays the most current solutions. Other video cards are added and removed from the chart at the request of the reader.

Sandland: Test VRAM
  • Max
  • All screen resolutions

  • Hide DLSS/FSR video cards

GEFORCE RTX 4090 24 GB
6528
5101
4634
GEFORCE RTX 4080 16 GB
5558
4173
3918
GEFORCE RTX 4070 Ti 12 GB
6484
3967
3647
GEFORCE RTX 3060 12 GB
6419
3927
3611
GEFORCE RTX 2080 Ti 11 GB
4888
4295
3987
GEFORCE RTX 3070 8 GB
4906
4219
3945
GEFORCE RTX 3060 Ti 8 GB
4916
4228
3953
GEFORCE RTX 2080 Super 8 GB
4896
4211
3937
GEFORCE RTX 2070 Super 8 GB
4857
4177
3906
GEFORCE RTX 2060 SUPER 8 GB
4823
4147
3878
GEFORCE RTX 2080 8 GB
4911
4224
3949
GEFORCE RTX 2070 8 GB
4921
4232
3957
Radeon RX 7900 XTX 24 GB
5170
4242
3951
Radeon RX 6900 XT 16 GB
4879
4162
3796
Radeon RX 6800 16 GB
4781
4079
3720
Radeon RX 6700 XT 12 GB
4645
3931
3493
Radeon RX 6600 XT 8 GB
4593
3859
3627

GameGPU

 - 3840x2160, Mbyte
 - 2560x1440, Mbyte
 - 1920x1080, Mbyte

 At a resolution of  1920x1080,  video memory consumption for video cards with 8 gigabytes is 7 gigabytes , with 12 gigabytes 7 gigabytes , with 16 gigabytes 7 gigabytes , with 24 gigabytes 7 gigabytes .

At a resolution of 2560x1440, video memory consumption for video cards with 8 gigabytes is 8 gigabytes, with 12 gigabytes 8 gigabytes , with 16 gigabytes 8 gigabytes , with 24 gigabytes 8 gigabytes .

At a resolution of 3840x2160, video memory consumption for video cards with 8 gigabytes is 8 gigabytes, with 12 gigabytes 9 gigabytes , with 16 gigabytes 9 gigabytes , with 24 gigabytes 9 gigabytes .

CPU TEST 

SANDLAND Win64 Shipping 2024 04 29 18 06 22 153

Testing was carried out at a resolution of 1920x1080. In the processor test, you can remove or add any processor positions. You can also select any tested video card from the list in the drop-down menu, comparing its performance with the given processor test results  (by default, the most productive solution from NVIDIA is selected). Testing takes place on the most powerful NVIDIA and AMD video cards and scales to low-end models.

Sandland: Test CPU
  • Max
  • All screen resolutions

  • All processors

  • Loading...

 When using NVIDIA video cards , Ryzen 3 3100 or Core i 3 10100 processors showed an acceptable rate of at least 25 frames per second  , and solutions at the Ryzen 3 3100 or Core i 3 10100 level can provide an FPS rate of at least 60 frames per second .  

When using AM D video cards , Ryzen 3 3100 or Core i 3 10100 processors showed an acceptable rate of at least 25 frames per second  , and solutions at the Ryzen 3 3100 or Core i 3 10100 level can provide an FPS rate of at least 60 frames per second .   

Sandland: Test Cores
  • Max
  • All screen resolutions

  • All processors

Intel Core i9 10900K 3.7 GHz
1 core
10 core
2 core
3 core
4 core
5 core
6 core
7 core
8 core
9 core
1 HT
10 HT
2 HT
3 HT
4 HT
5 HT
6 HT
7 HT
8 HT
9 HT
19
35
66
67
24
13
30
52
31
11
15
11
6
25
66
29
7
8
29
12
Intel Core i7 10700K 3.8 GHz
1 core
2 core
3 core
4 core
5 core
6 core
7 core
8 core
1 HT
2 HT
3 HT
4 HT
5 HT
6 HT
7 HT
8 HT
56
61
66
44
40
25
2
20
11
14
32
22
14
20
17
26
Intel Core i5 10600K 4.1 GHz
1 core
2 core
3 core
4 core
5 core
6 core
1 HT
2 HT
3 HT
4 HT
5 HT
6 HT
56
64
69
47
40
41
16
17
23
21
26
27
Intel Core i3 10100 3.6 GHz
1 core
2 core
3 core
4 core
1 HT
2 HT
3 HT
4 HT
70
64
79
70
80
72
74
59
AMD Ryzen 9 3900X 3.8 GHz
1 core
10 core
11 core
12 core
2 core
3 core
4 core
5 core
6 core
7 core
8 core
9 core
1 SMT
10 SMT
11 SMT
12 SMT
2 SMT
3 SMT
4 SMT
5 SMT
6 SMT
7 SMT
8 SMT
9 SMT
31
28
31
41
44
25
41
64
63
2
36
17
73
1
3
6
31
14
63
8
3
5
3
2
AMD Ryzen 7 3800X 3.9 GHz
1 core
2 core
3 core
4 core
5 core
6 core
7 core
8 core
1 SMT
2 SMT
3 SMT
4 SMT
5 SMT
6 SMT
7 SMT
8 SMT
72
63
73
78
66
41
28
23
11
61
6
5
9
8
7
1
AMD Ryzen 5 3600X 3.8 GHz
1 core
2 core
3 core
4 core
5 core
6 core
1 SMT
2 SMT
3 SMT
4 SMT
5 SMT
6 SMT
70
38
34
42
71
64
66
31
20
9
41
44
AMD Ryzen 3 3300 3.8 GHz
1 core
2 core
3 core
4 core
1 SMT
2 SMT
3 SMT
4 SMT
73
63
77
73
39
69
53
36

GameGPU

 - 1920x1080, %

The game can load up to 12 streams. Uses up to 8 threads as efficiently as possible.

RAM TEST

sys

The test was carried out on the basic configuration of Core i 9 13900K with 32 GB DDR5 6400 MHz pre-installed memory. All used RAM was taken as an indicator. The RAM test for the entire system was carried out on various video cards without launching third-party applications (browsers, etc.). In the graphics, you can add and remove any resolutions and video cards as desired.

Sandland: Test RAM
  • Max
  • All screen resolutions

  • Hide DLSS/FSR video cards

GEFORCE RTX 4090 24 GB
8787
8650
8354
GEFORCE RTX 4080 16 GB
8421
8358
8245
GEFORCE RTX 4070 Ti 12 GB
8738
8611
8668
GEFORCE RTX 3060 12 GB
8651
8525
8581
GEFORCE RTX 2080 Ti 11 GB
8201
8243
8205
GEFORCE RTX 3070 8 GB
7798
7770
7971
GEFORCE RTX 3060 Ti 8 GB
7813
7785
7987
GEFORCE RTX 2080 Super 8 GB
7782
7754
7955
GEFORCE RTX 2070 Super 8 GB
7719
7692
7891
GEFORCE RTX 2060 SUPER 8 GB
7665
7637
7835
GEFORCE RTX 2080 8 GB
7805
7777
7979
GEFORCE RTX 2070 8 GB
7821
7793
7995
Radeon RX 7900 XTX 24 GB
8574
8532
8715
Radeon RX 6900 XT 16 GB
8421
8334
8345
Radeon RX 6800 16 GB
8253
8167
8178
Radeon RX 6700 XT 12 GB
8578
8536
8410
Radeon RX 6600 XT 8 GB
9079
9043
9057

GameGPU

 - 3840x2160, Mbyte
 - 2560x1440, Mbyte
 - 1920x1080, Mbyte

 At a resolution of  1920x1080,  RAM consumption for video cards with 8 gigabytes is 8 gigabytes , with 12 gigabytes 8 gigabytes , with 16 gigabytes 8 gigabytes, with 24 gigabytes 8 gigabytes .

At a resolution of  2560x1440,  RAM consumption for video cards with 8 gigabytes is 8 gigabytes , with 12 gigabytes 8 gigabytes , with 16 gigabytes 8 gigabytes , with 24 gigabytes 8 gigabytes.  

At a resolution of  3840x2160,  RAM consumption for video cards with 8 gigabytes is 8 gigabytes , with 12 gigabytes 8 gigabytes , with 16 gigabytes 8 gigabytes , with 24 gigabytes 8 gigabytes .

SPONSORS TESTS
aorus asus rog
  Kingston FURY logo
  art