


Summing up the gaming solutions of 2022
| BASIS MATERIAL INFORMATION |

Well, at the end of our testing, we present our debut material to determine the fastest solutions of the past year. Below is a list of 11 of our reviews, on the basis of which our conclusions were based:
ELDEN RING GPU/CPU benchmark 2022
God of War GPU/CPU benchmark 2022
Dying Light 2: Stay Human GPU/CPU benchmark 2022
F1 22 GPU/CPU benchmark 2022
Marvel's Spider-Man Remastered GPU/CPU benchmark 2022
Gotham Knights GPU/CPU benchmark 2022
A Plague Tale: Requiem GPU/CPU Test 2022
Call of Duty: Warzone 2.0 GPU/CPU Test 2022
UNCHARTED: Legacy of Thieves Collection GPU/CPU Test 2022
Marvel’s Spider-Man: Miles Morales GPU/CPU Test 2022
The Callisto Protocol GPU/CPU Test/ CPU 2022
| DETERMINING THE MOST PERFORMING SOLUTIONS AMONG VIDEO CARDS |
All our hardware was tested on the test configurations below:
| Test configuration | |
| test stands |
GIGABYTE Z590 VISION |
| Sponsored Video Cards |
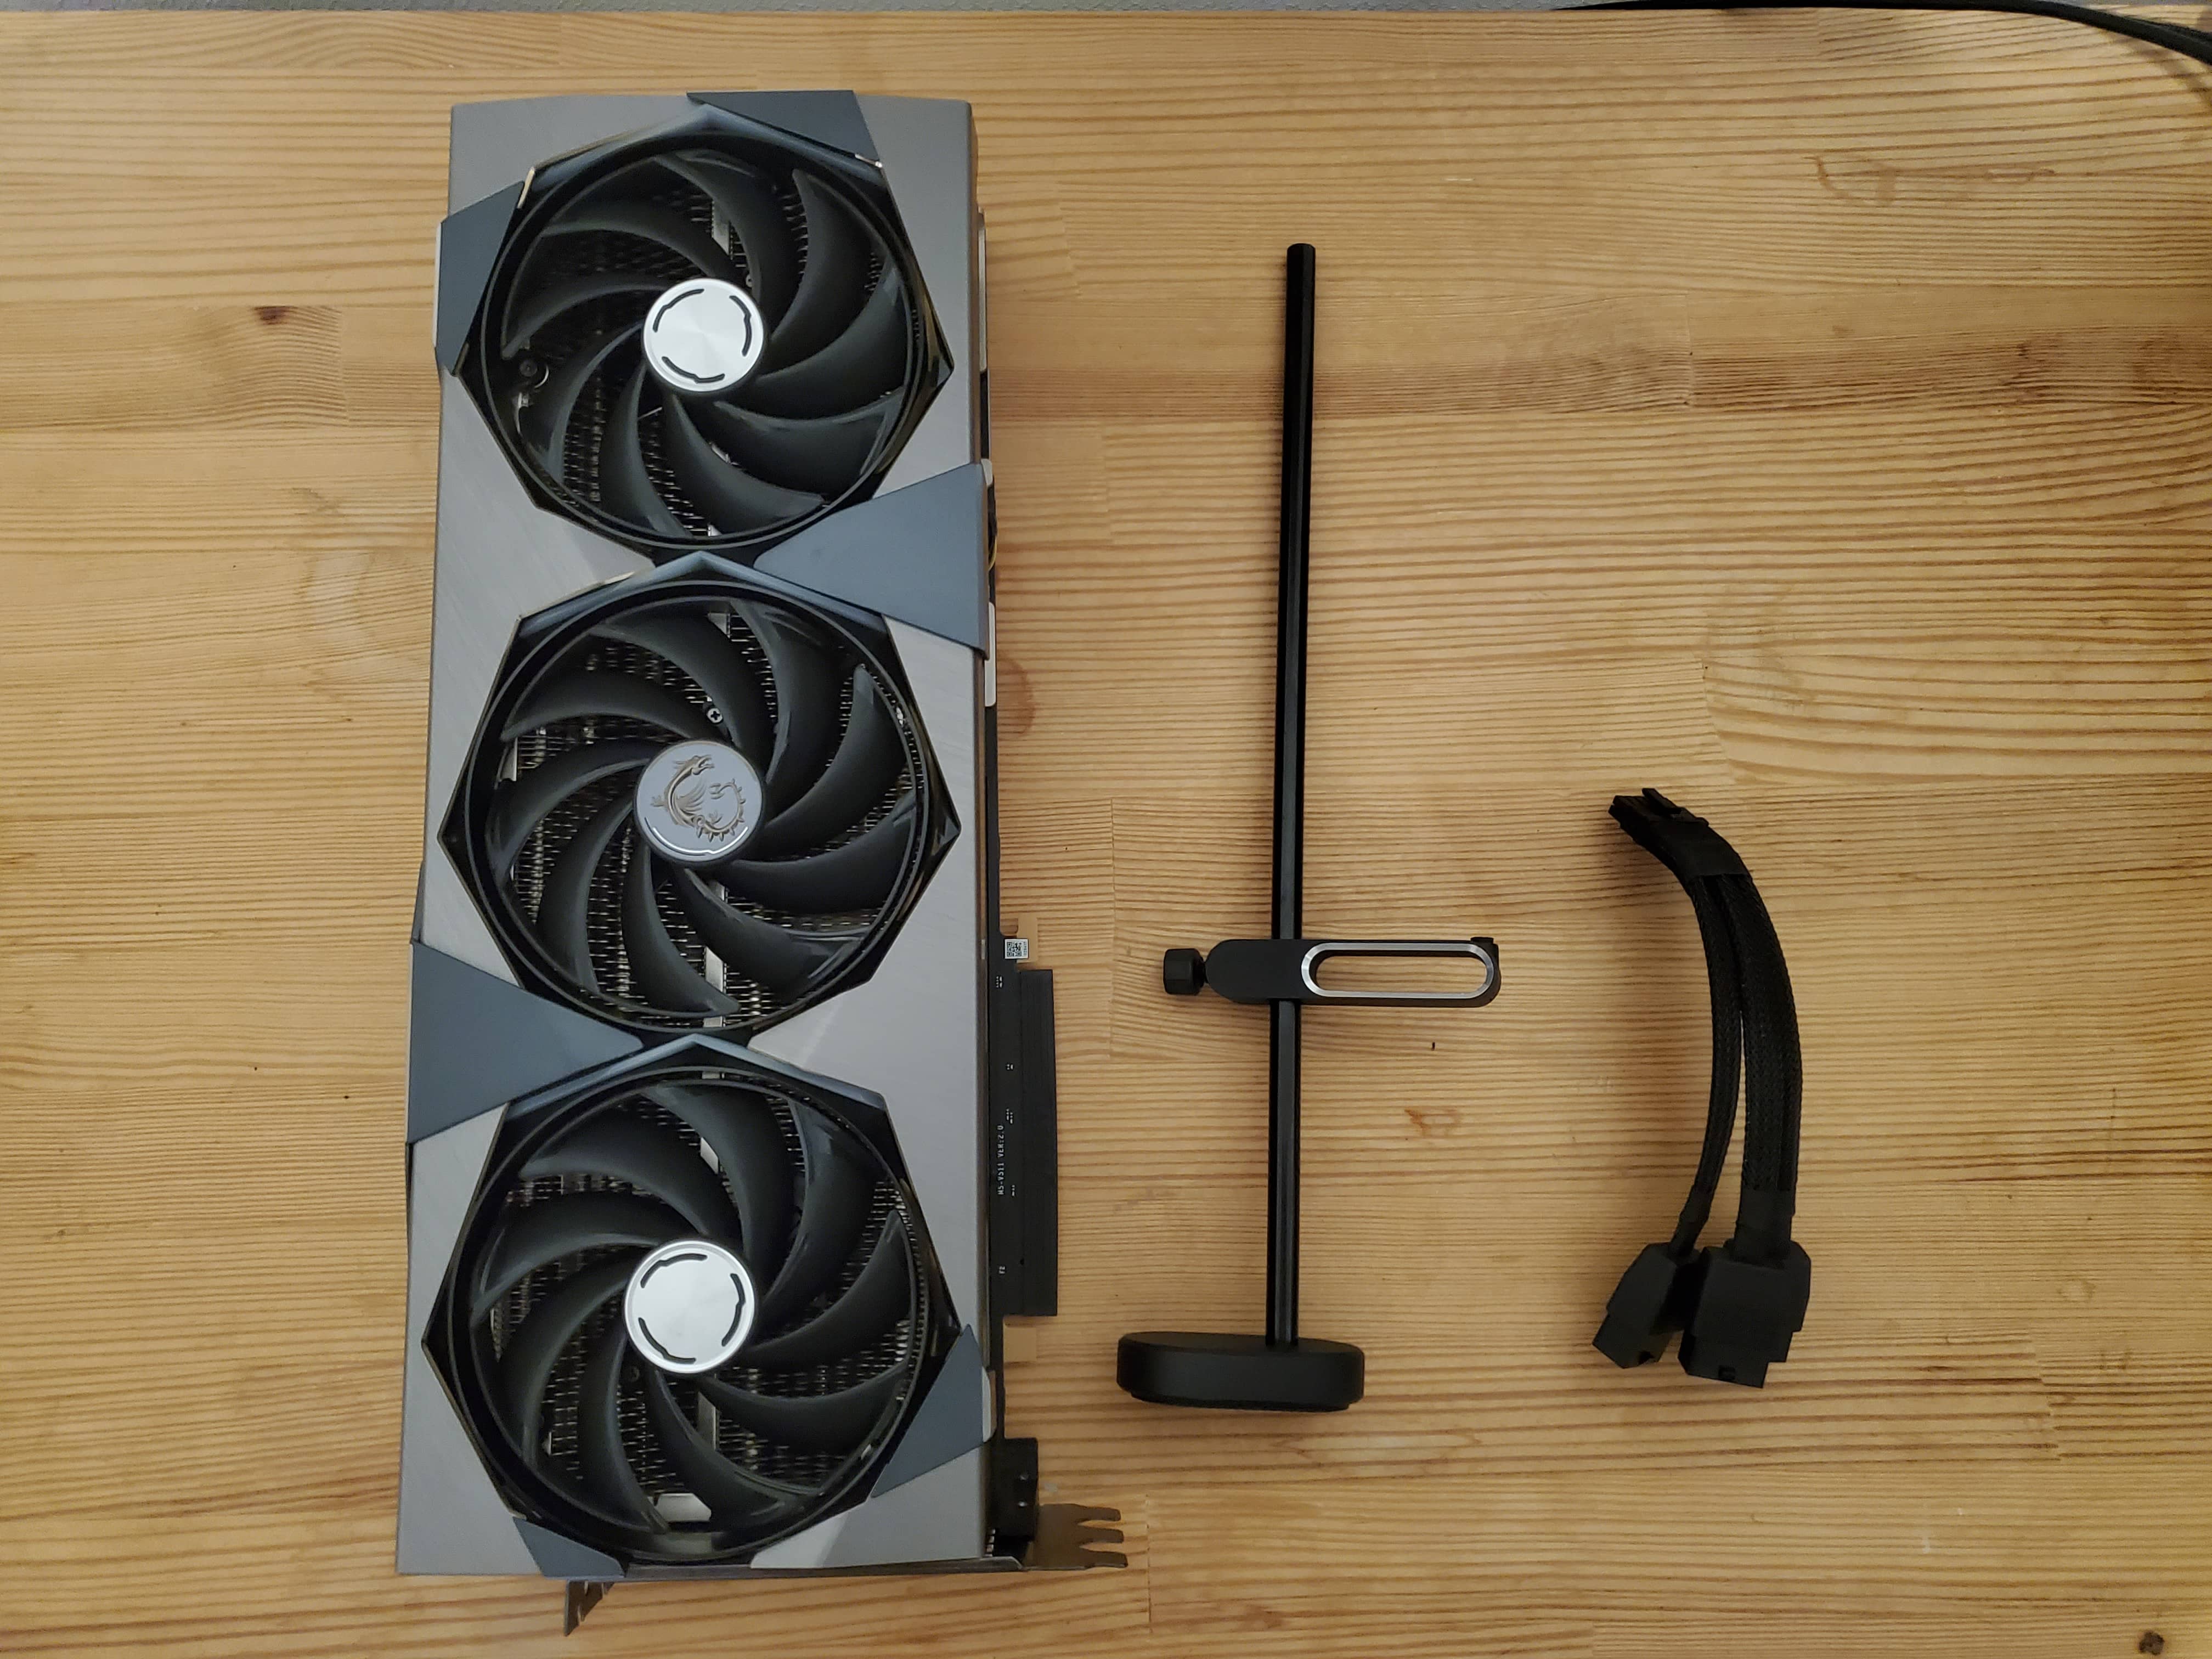
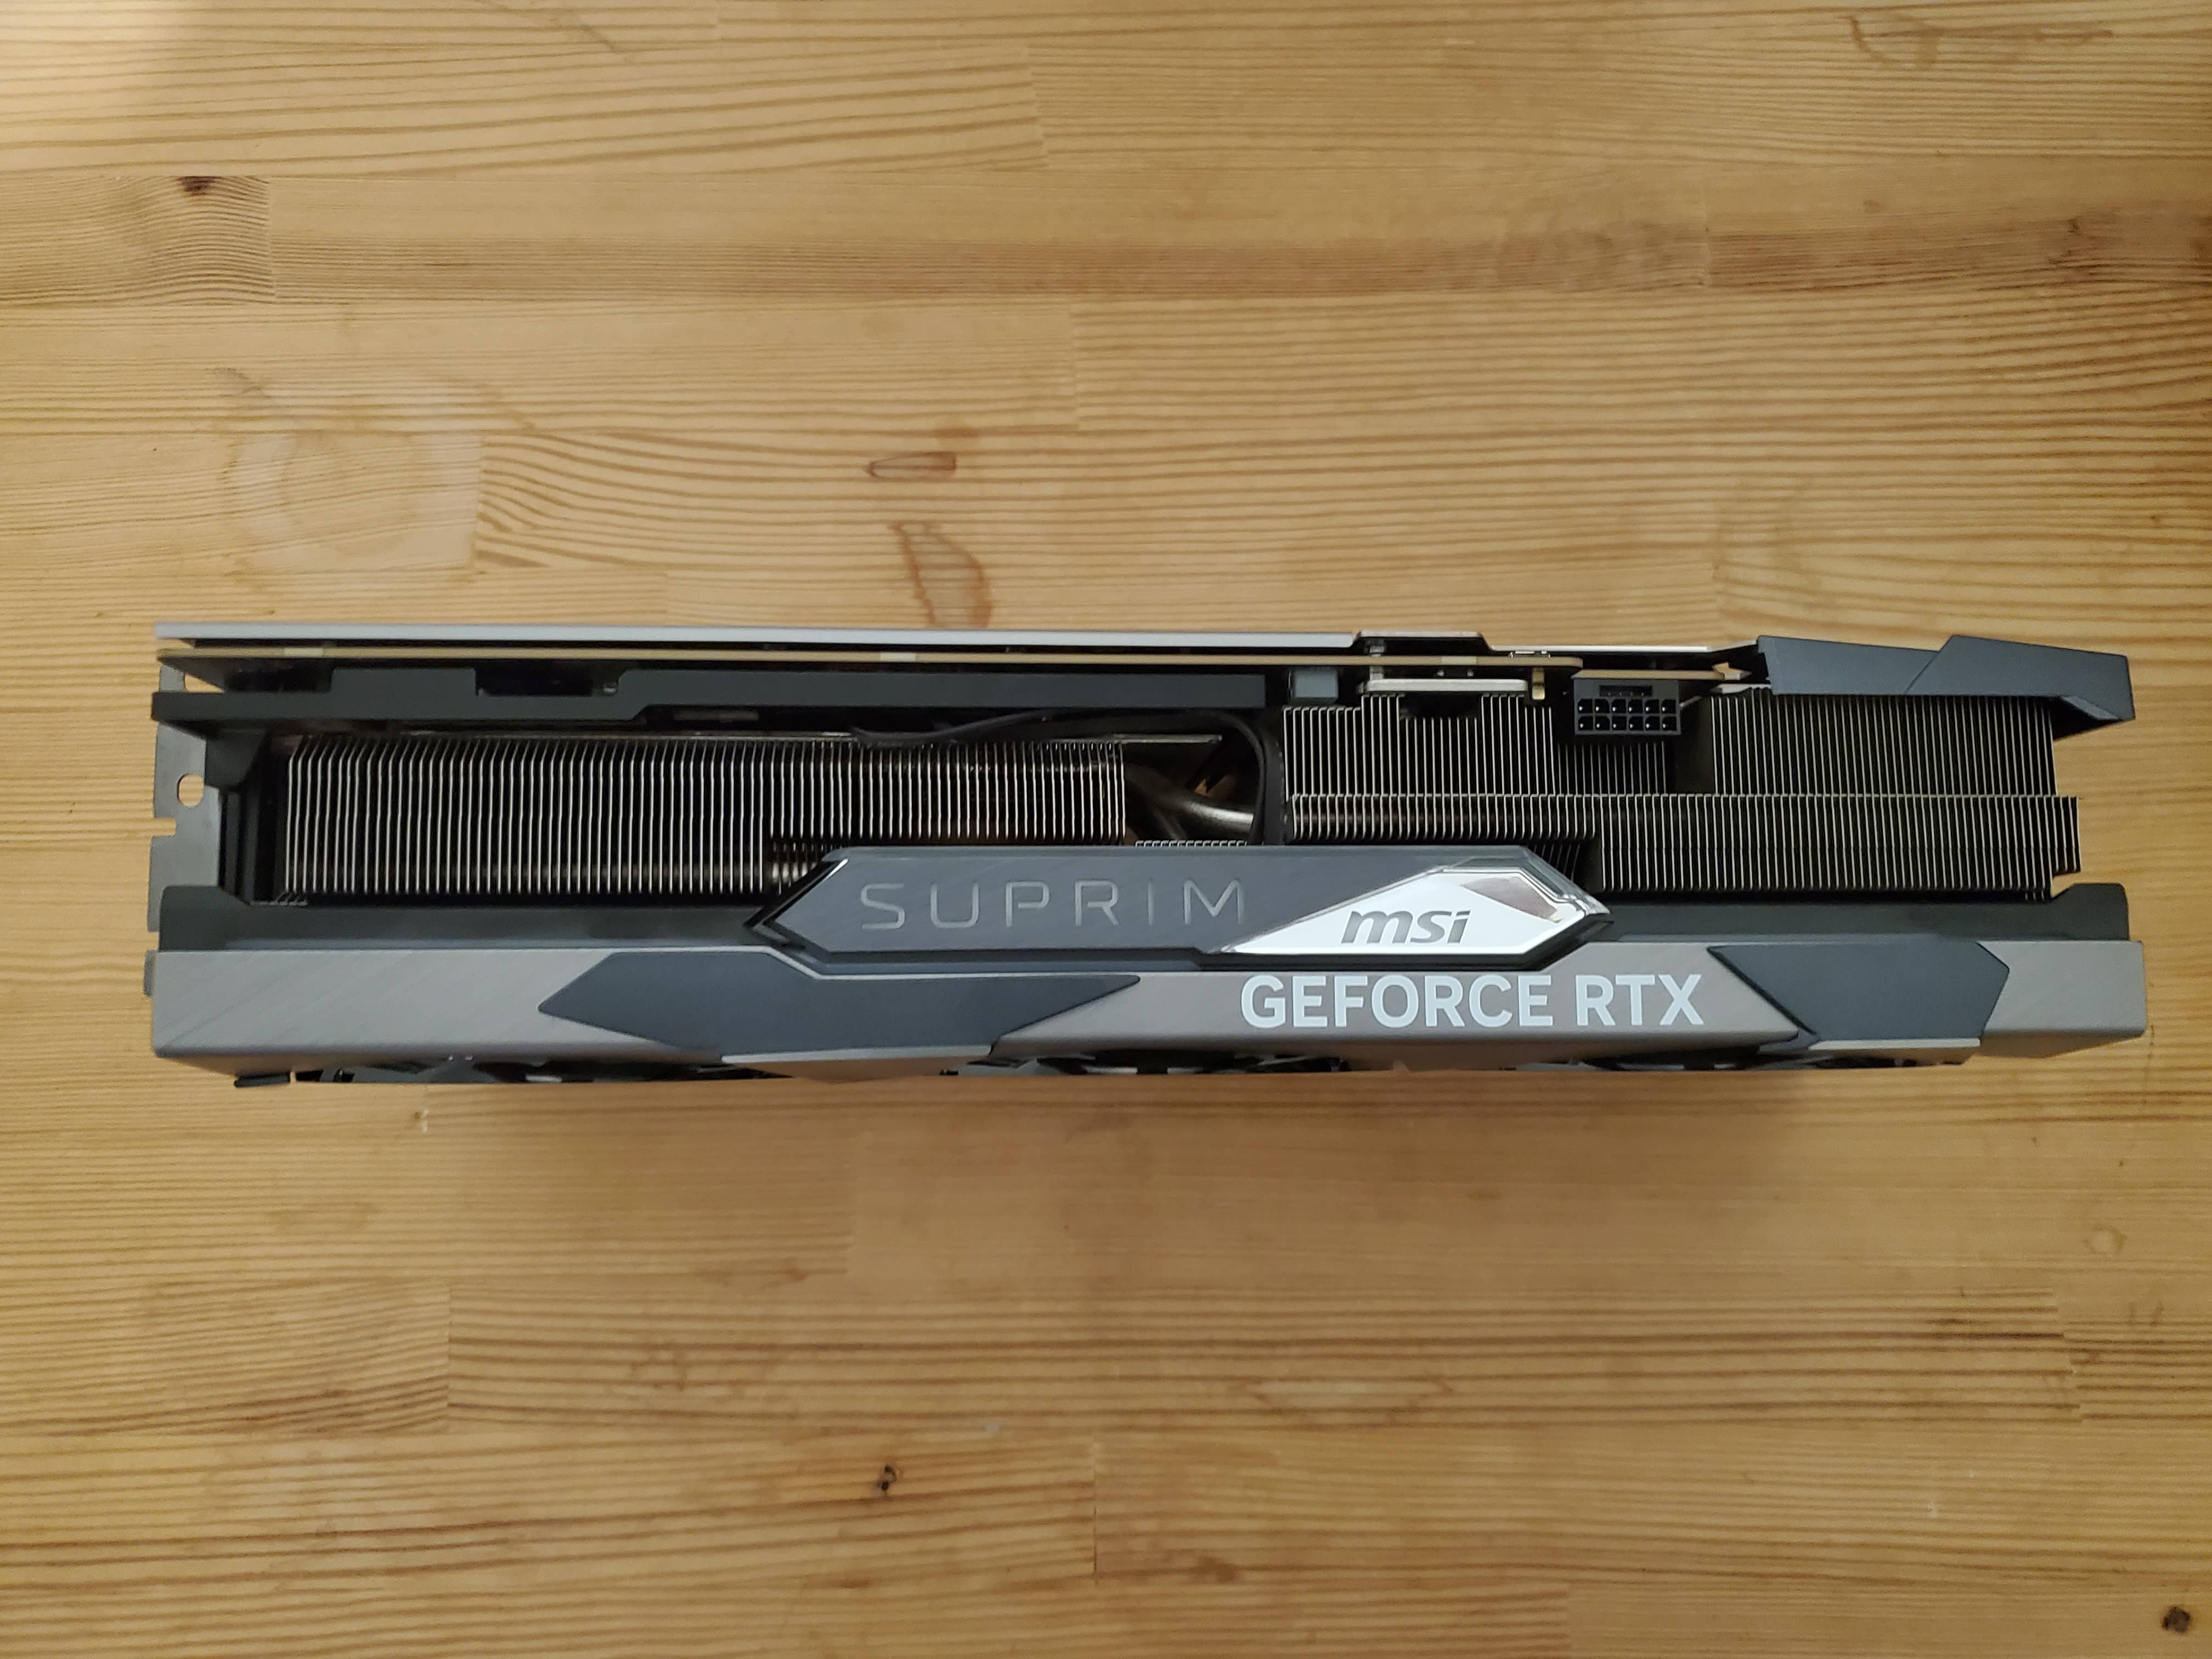
MSI GEFORCE RTX 4090 SUPRIM X 24 GB MSI GEFORCE RTX 4080 SUPRIM X 16 GB MSI GEFORCE RTX 3080 SUPRIM X 12 GB MSI GEFORCE RTX 3070 Ti GAMING TRIO 8 GB MSI GEFORCE RTX 3050 GAMING X 8 GB |
| multimedia equipment |
Power Supply Seasonic PRIME TX-1000 Kingston XS2000 Portable SSD 1 TB - the optimal solution for testing different configurations 32 GB DDR4 3600 CL16 Kingston FURY Renegade 32 GB DDR4 4000 CL18 Kingston FURY Renegade 32 GB DDR5 5600 CL40 KingstonFURY Beast 32 GB DDR5 6000@6400 CL30 KingstonFURY Renegade Kingston FURY Renegade PCIe 4.0 NVMe M.2 SSD Case MPG CORELIQUID K240 |
| Software configuration |
|
| operating system | Windows 10 21H2/ Windows 11(Alder Lake) |
| Graphics driver |
Nvidia GeForce/ION Driver Release 527.62 WHQL AMD Radeon Adrenalin Edition 22.12.2 |
| Monitoring programs |
MSI Afterburner |


Total performance
Next, we will start processing the results of our test. So, in order to find out what the fastest solutions are video cards in games of 2021, we will sum up their total FPS in the games tested.

At all resolutions, MSI GeForce RTX 4090 SUPRIM X was in first place, MSI GeForce RTX 4080 SUPRIM X in second, and ASUS Radeon RX 7900 XTX in third.
Relative performance
Each chart shows the tested MSI GeForce RTX 4090 SUPRIM X graphics card as 100% performance and shows the % performance of any other graphics card relative to it. The percentage indicator was displayed for each game separately, and then from all these indicators an average% was displayed relative to all the games tested.
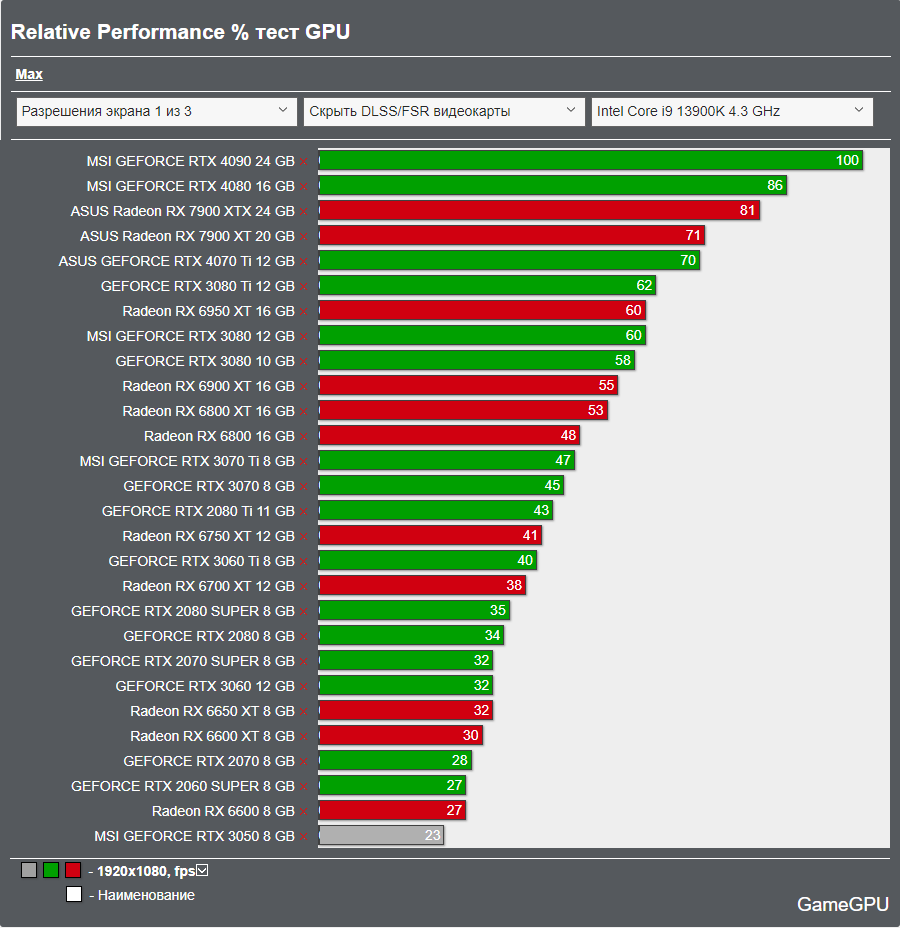
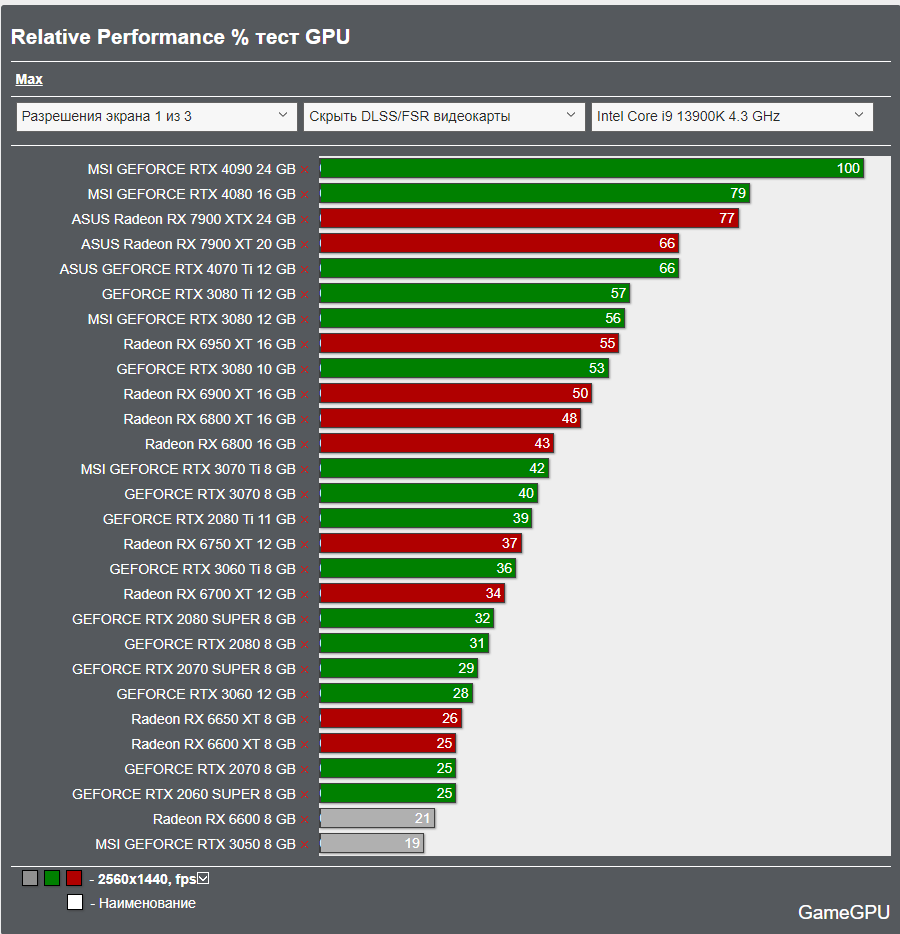
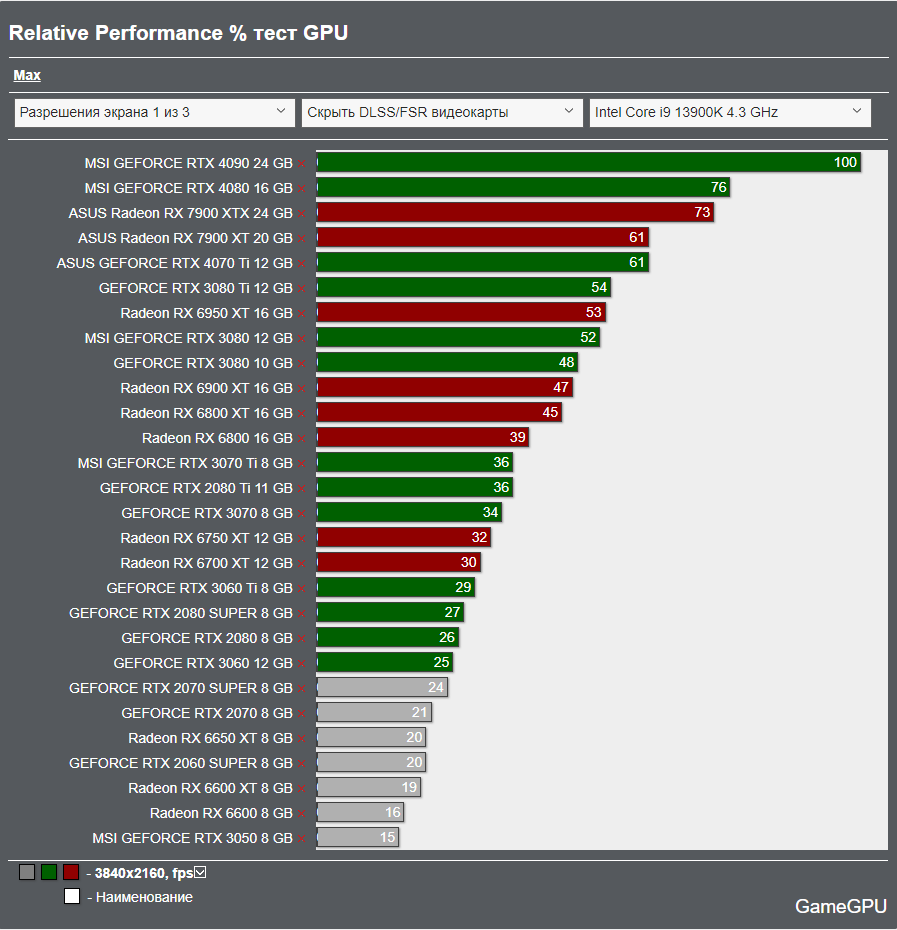
The higher the resolution, the further the MSI GeForce RTX 4090 SUPRIM X moves away from its companions in the face of the MSI GeForce RTX 4080 SUPRIM X ASUS Radeon RX 7900 XTX. And if at a resolution of 1920x1080 they are only 15% behind, then at 2560x1440 they are 22% behind, and at 4K the lag is already up to 27%.
| DETERMINATION OF THE MOST PERFORMING SOLUTIONS AMONG PROCESSORS |
Total performance
Next, we will start processing the results of our test. So, in order to find out what the fastest solutions are CPUs in 2021 games, we will also sum up their total FPS in the games tested.
When using NVIDIA video cards , the top three looks like this: Core i9 13900K, AMD Ryzen 7 7700 X, Core i9 12900K .
When using AMD graphics cards , the same top three are Core i9 13900K, AMD Ryzen 7 7700 X and Core i9 12900K .
Relative performance
Each chart shows the tested Core i9 13900K as 100% performance and shows the % performance of any other processor relative to it. The percentage indicator was displayed for each game separately, and then from all these indicators an average% was displayed relative to all the games tested.
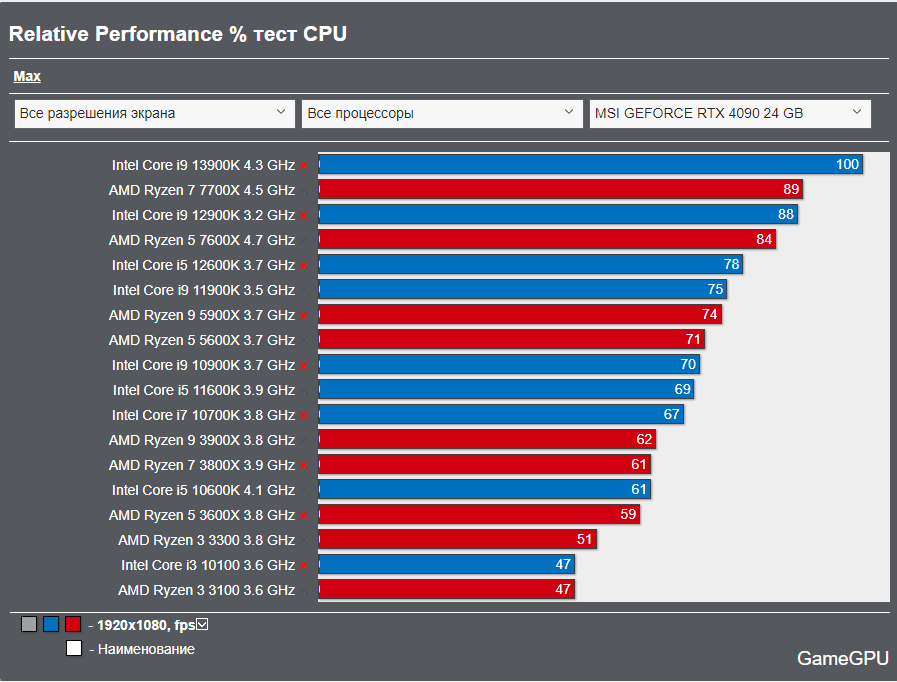
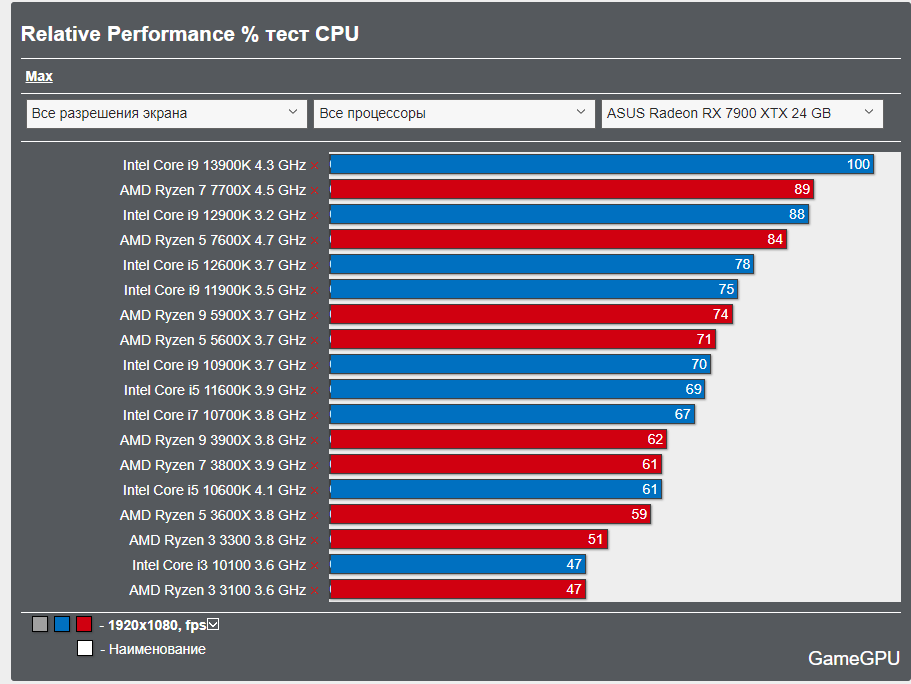
Each chart shows the tested Core i9 13900K as 100% performance and shows the % performance of any other processor relative to it.
| DETERMINATION OF THE MOST OPTIMAL SOLUTIONS AMONG VIDEO CARDS |
Video card prices
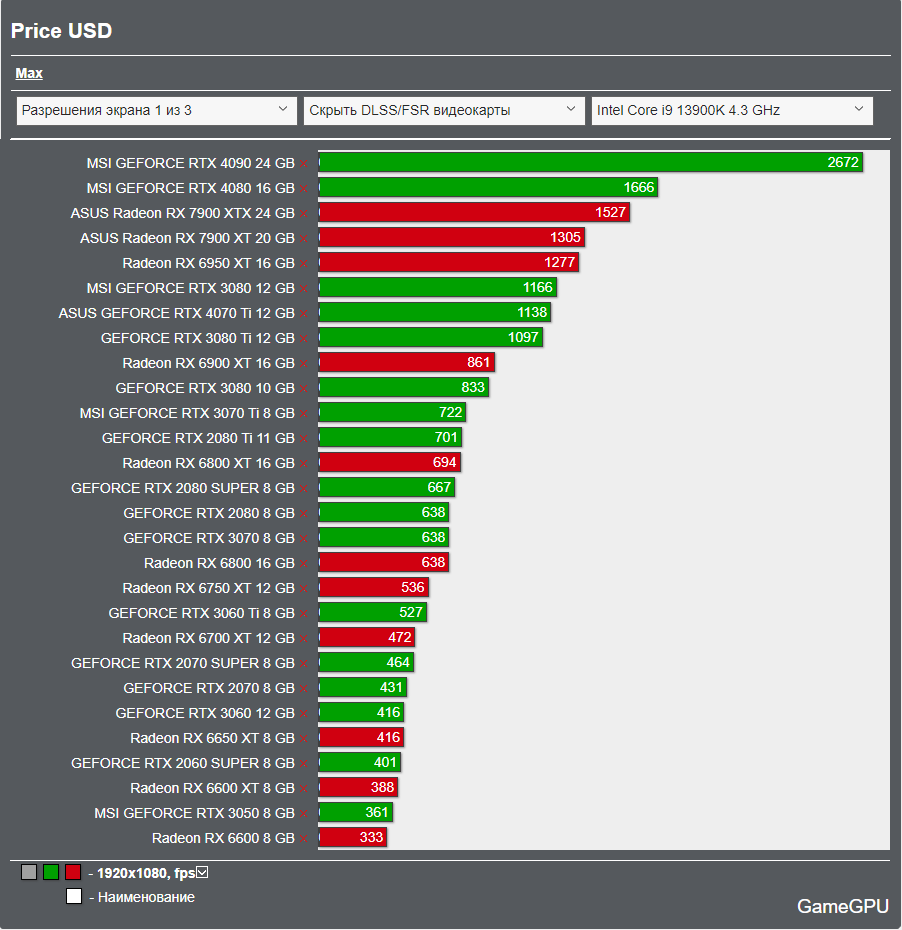
The price was taken on the basis of proposals for the average minimum price of each solution, which can be found in Hotline catalogs for the month of December, although their availability may be in doubt.
Total FPS/$
And at the next stage, we identify the most optimal purchases, as a result of which we can buy the largest number of FPS for 1 $. We divide the total FPS by the cost of video cards and get the amount of FPS that we can purchase for $1. To avoid decimal digits, all the results were multiplied by 100 and thus we got the so-called graphics card performance-to-price ratio.
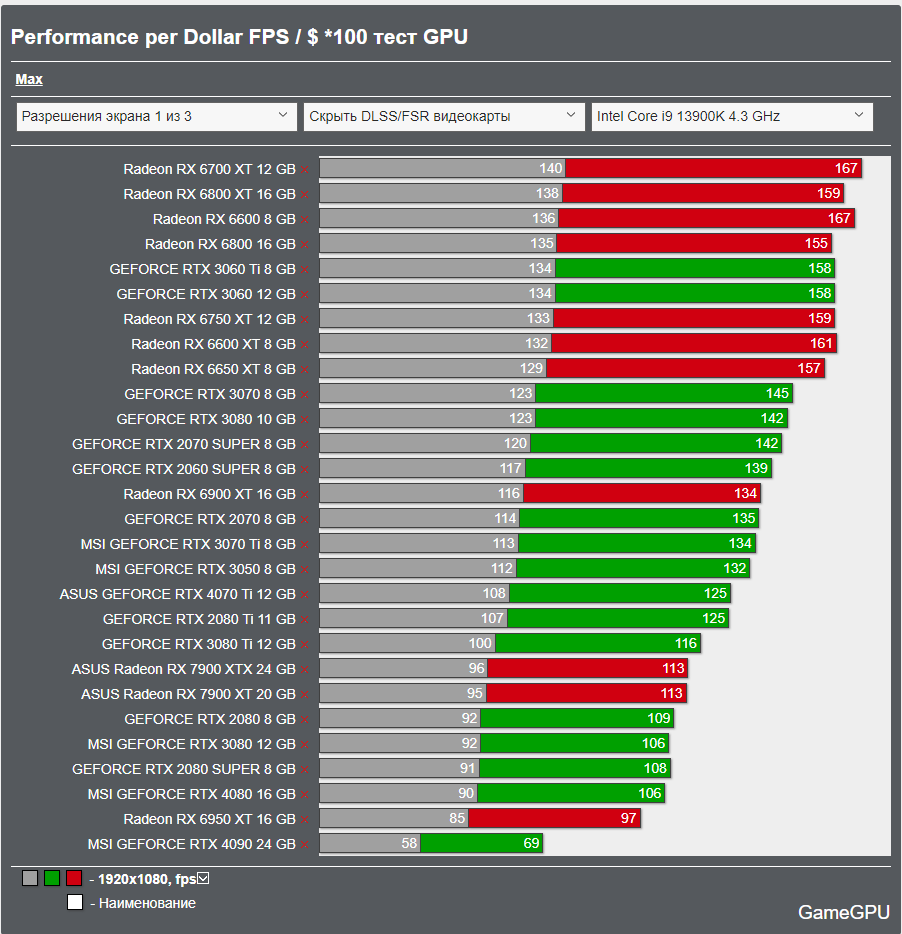
1920x1080 : AMD Radeon RX 6700 XT, AMD Radeon RX 6600, AMD Radeon RX 6600 XT lead in terms of FPS price ratio at this resolution.
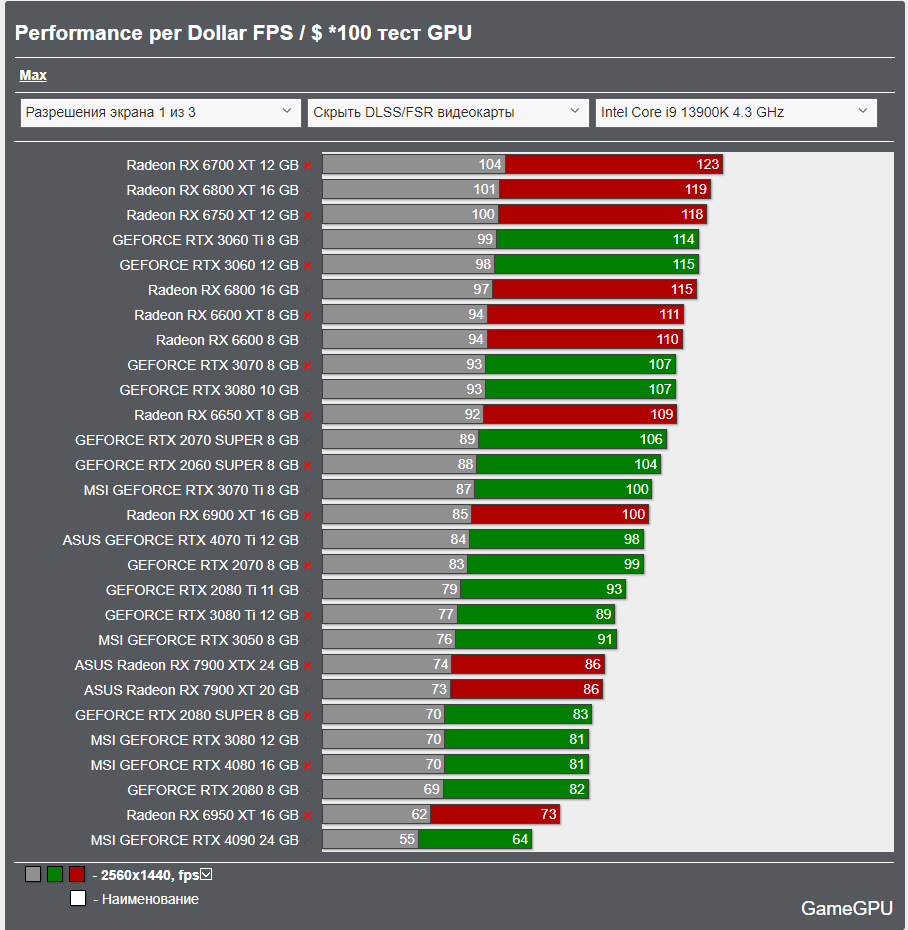
2560x1440 : AMD Radeon RX 6700 XT, AMD Radeon RX 6600, AMD Radeon RX 6600 XT lead in terms of FPS price ratio at this resolution.
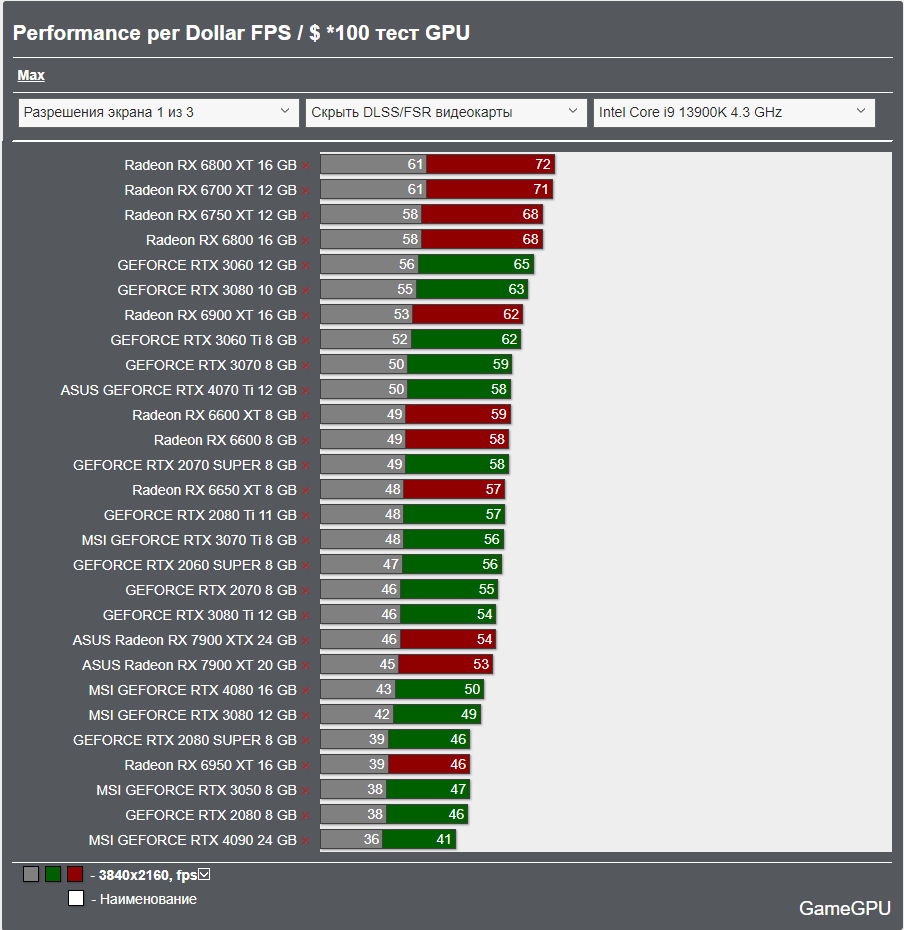
3840x2160: AMD Radeon RX 6800 XT, AMD Radeon RX 6700 XT , AMD Radeon RX 6750 XT are the leaders at this resolution in terms of FPS price ratio .
| DETERMINATION OF THE MOST OPTIMAL SOLUTIONS AMONG PROCESSORS |
Processor prices
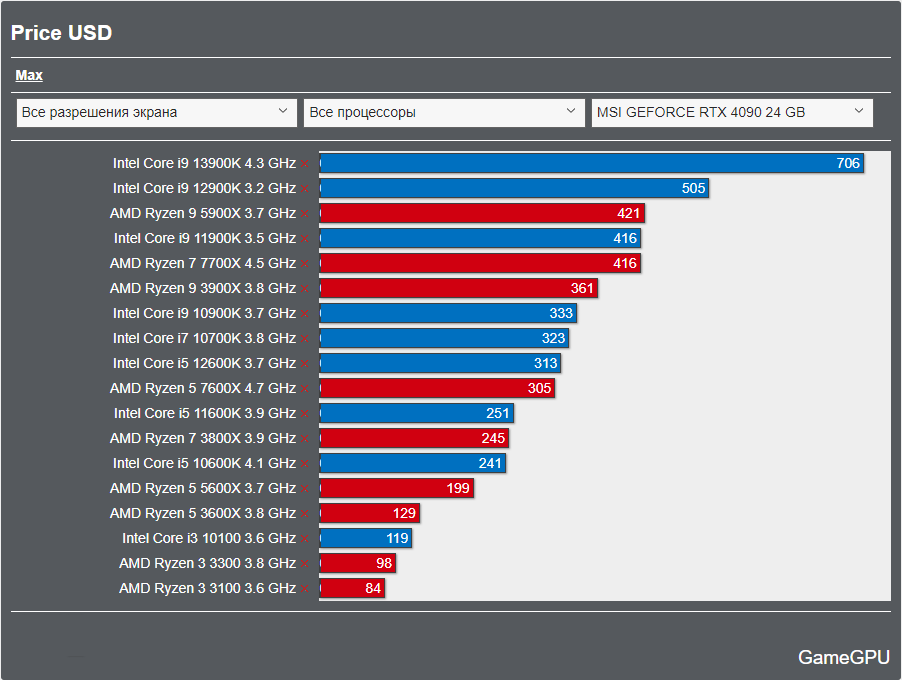
Now look at the cost of processors at the moment (the price was taken based on offers for the average minimum price of each solution, which can be found in the catalogs of some stores for the month of December, although their availability may be in doubt.
Total FPS/CPU Price 1920x1080
And at the next stage, we identify the most optimal purchases, as a result of which we can buy the largest number of FPS for 1 $. We divide the total FPS, and get the number of frames that we can purchase for $1. To avoid decimal digits, all results were multiplied by 10 and thus we got the so-called performance-to-price ratio.
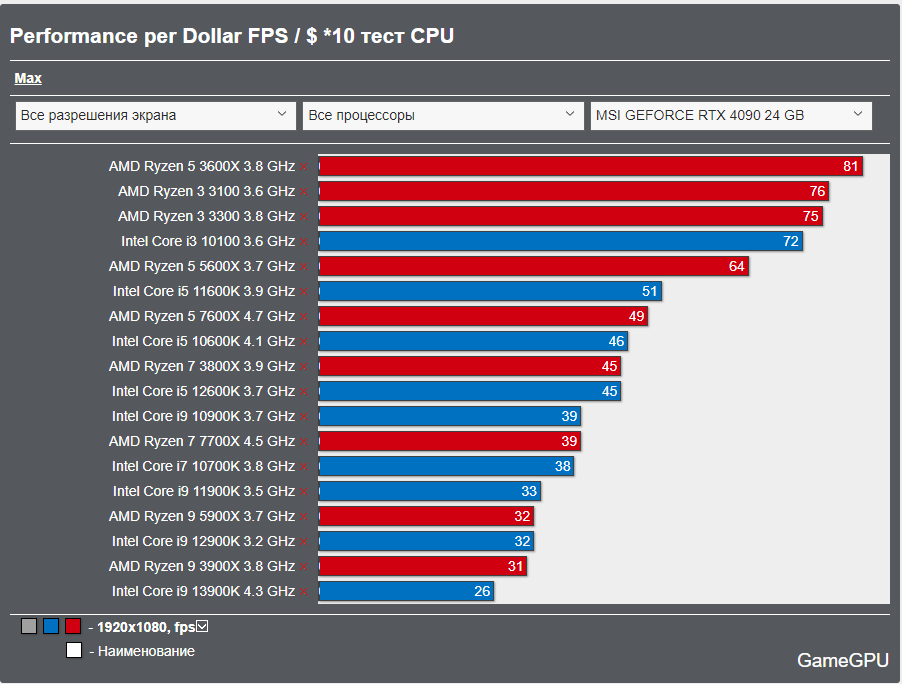
When using an NVIDIA graphics card, Ryzen 5 3600 , Ryzen 3 3100 and Ryzen 3 3300 are ahead in terms of FPS price ratio .

When using an NVIDIA graphics card, Ryzen 5 3600 , Ryzen 3 3100 and Ryzen 3 3300 are ahead in terms of FPS price ratio .
| Results |
As we can see, the results speak for themselves, now let's go directly to the results of the video cards provided to us for the annual review:
| MSI GEFORCE RTX 4090 SUPRIM X 24 GB
1
1
1
1
1
1
1
1
1
1
Rating 74% [5 Votes]
|
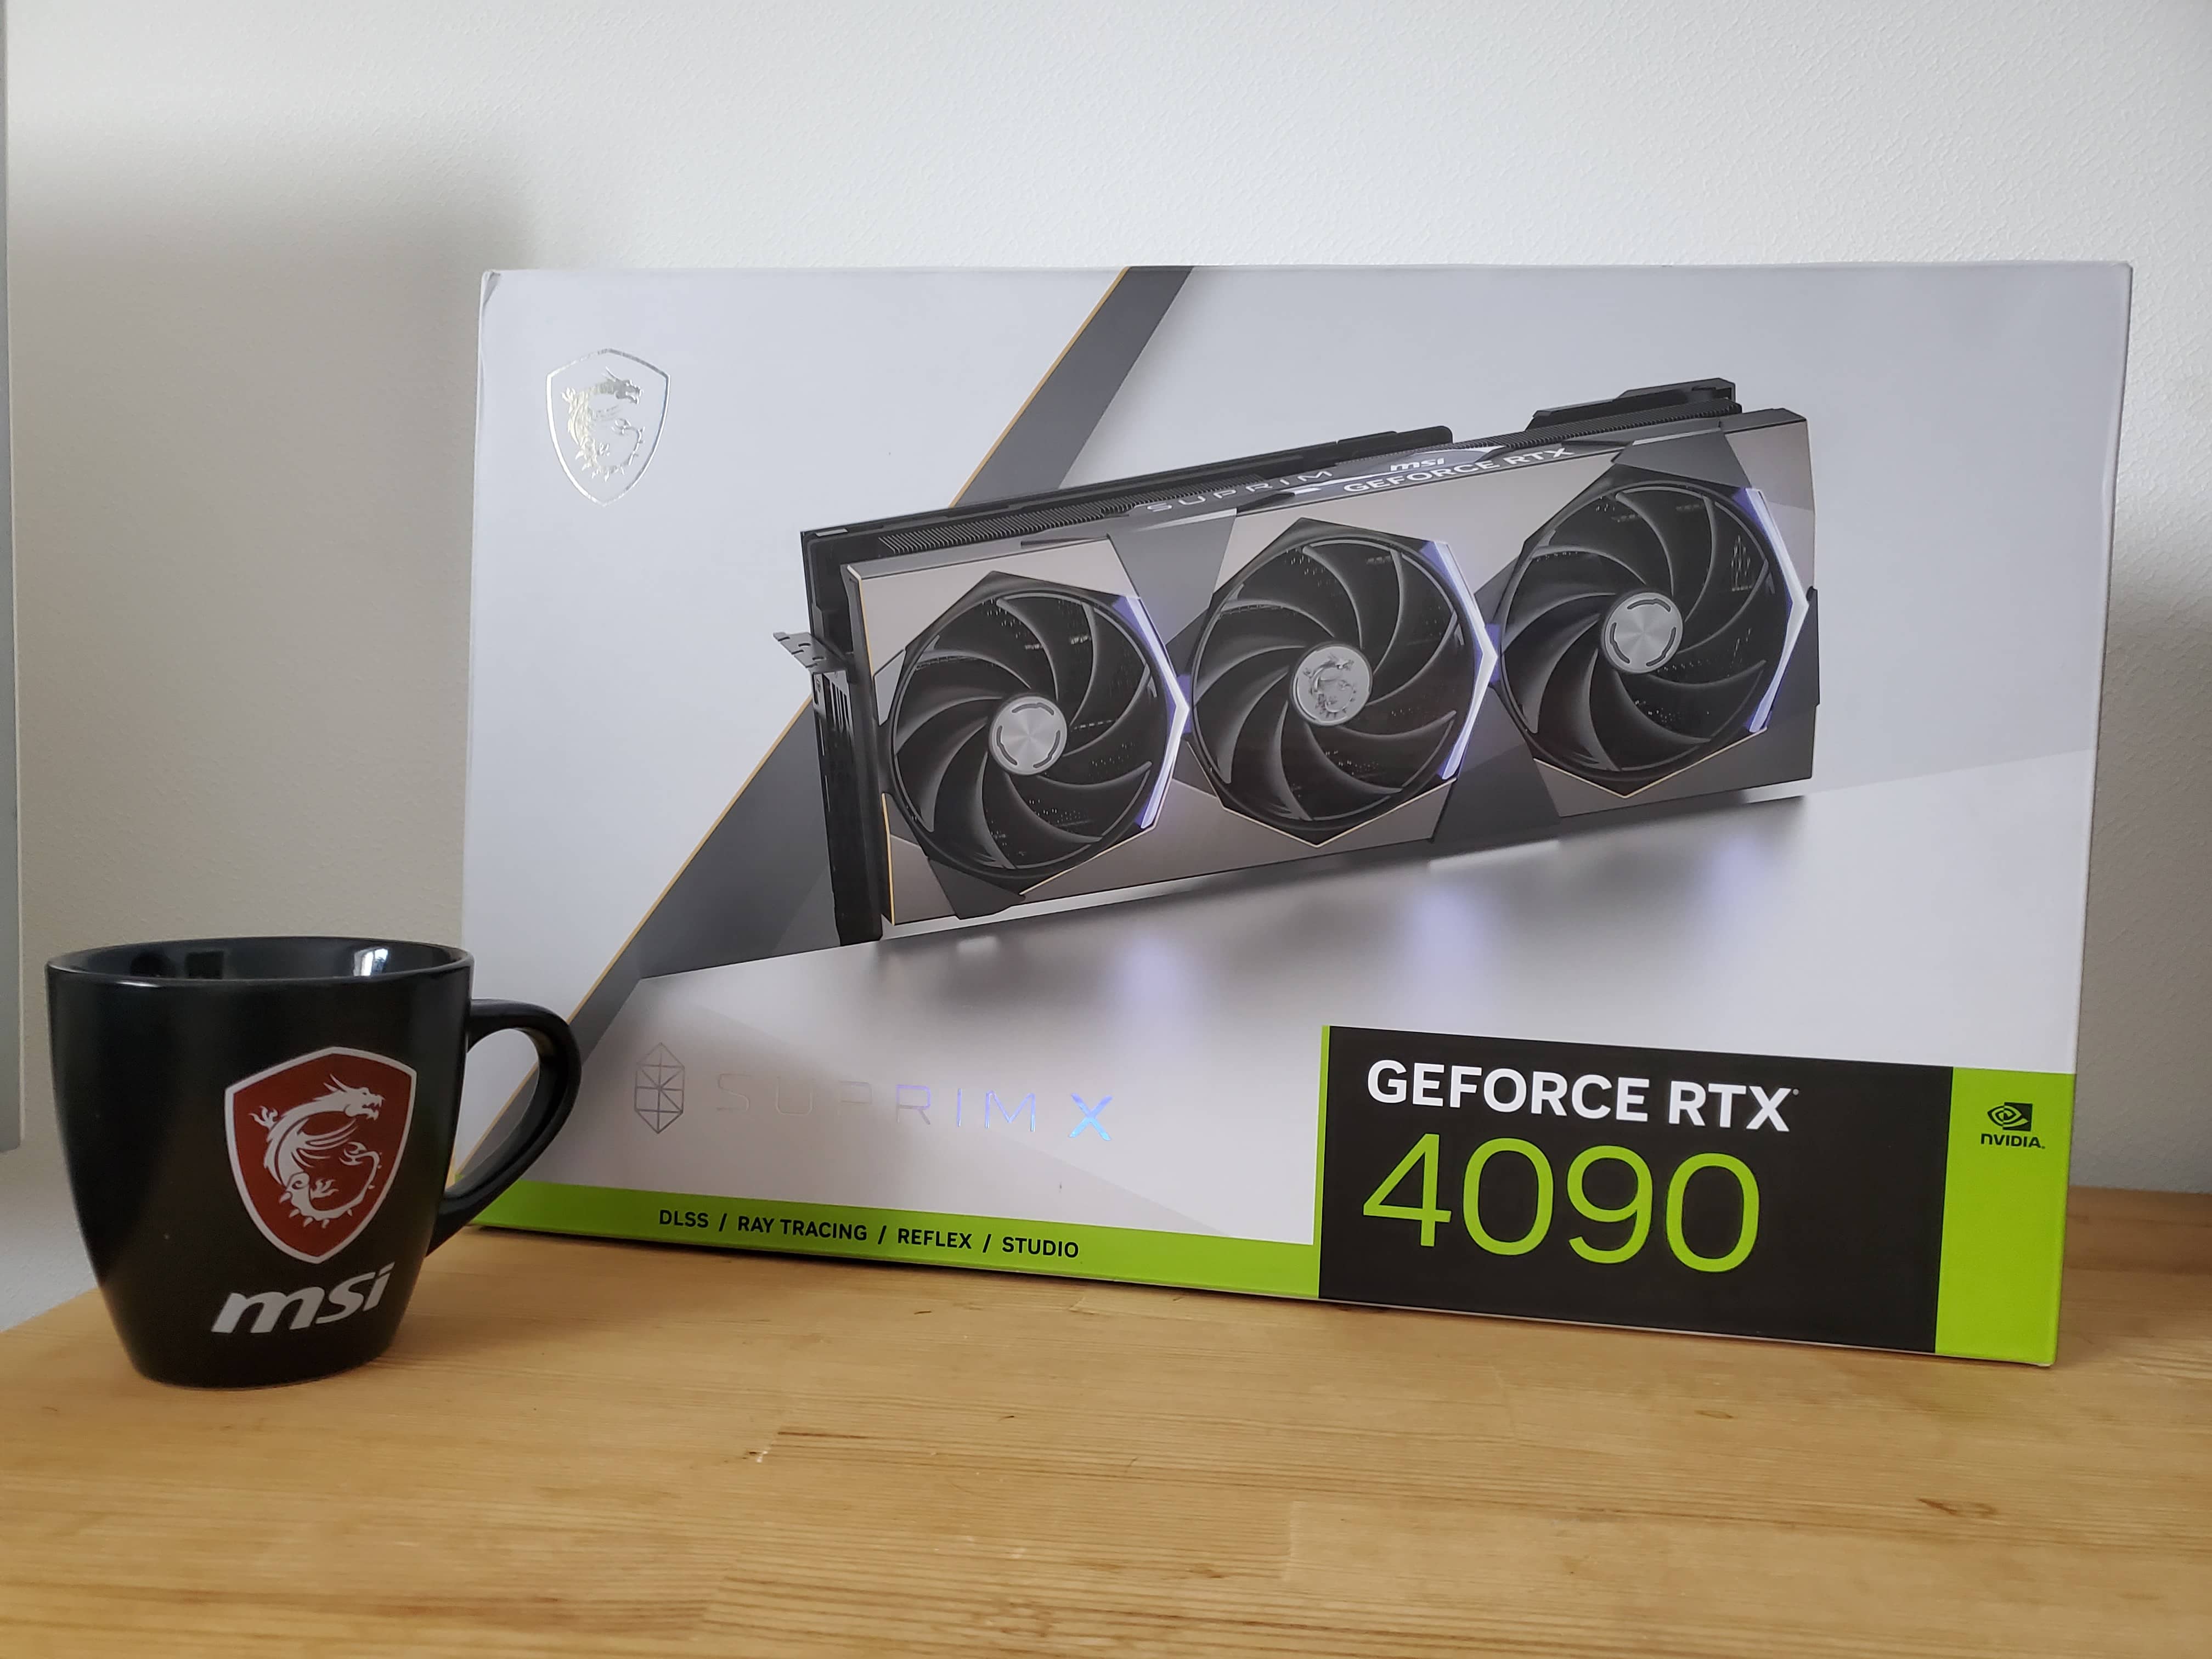
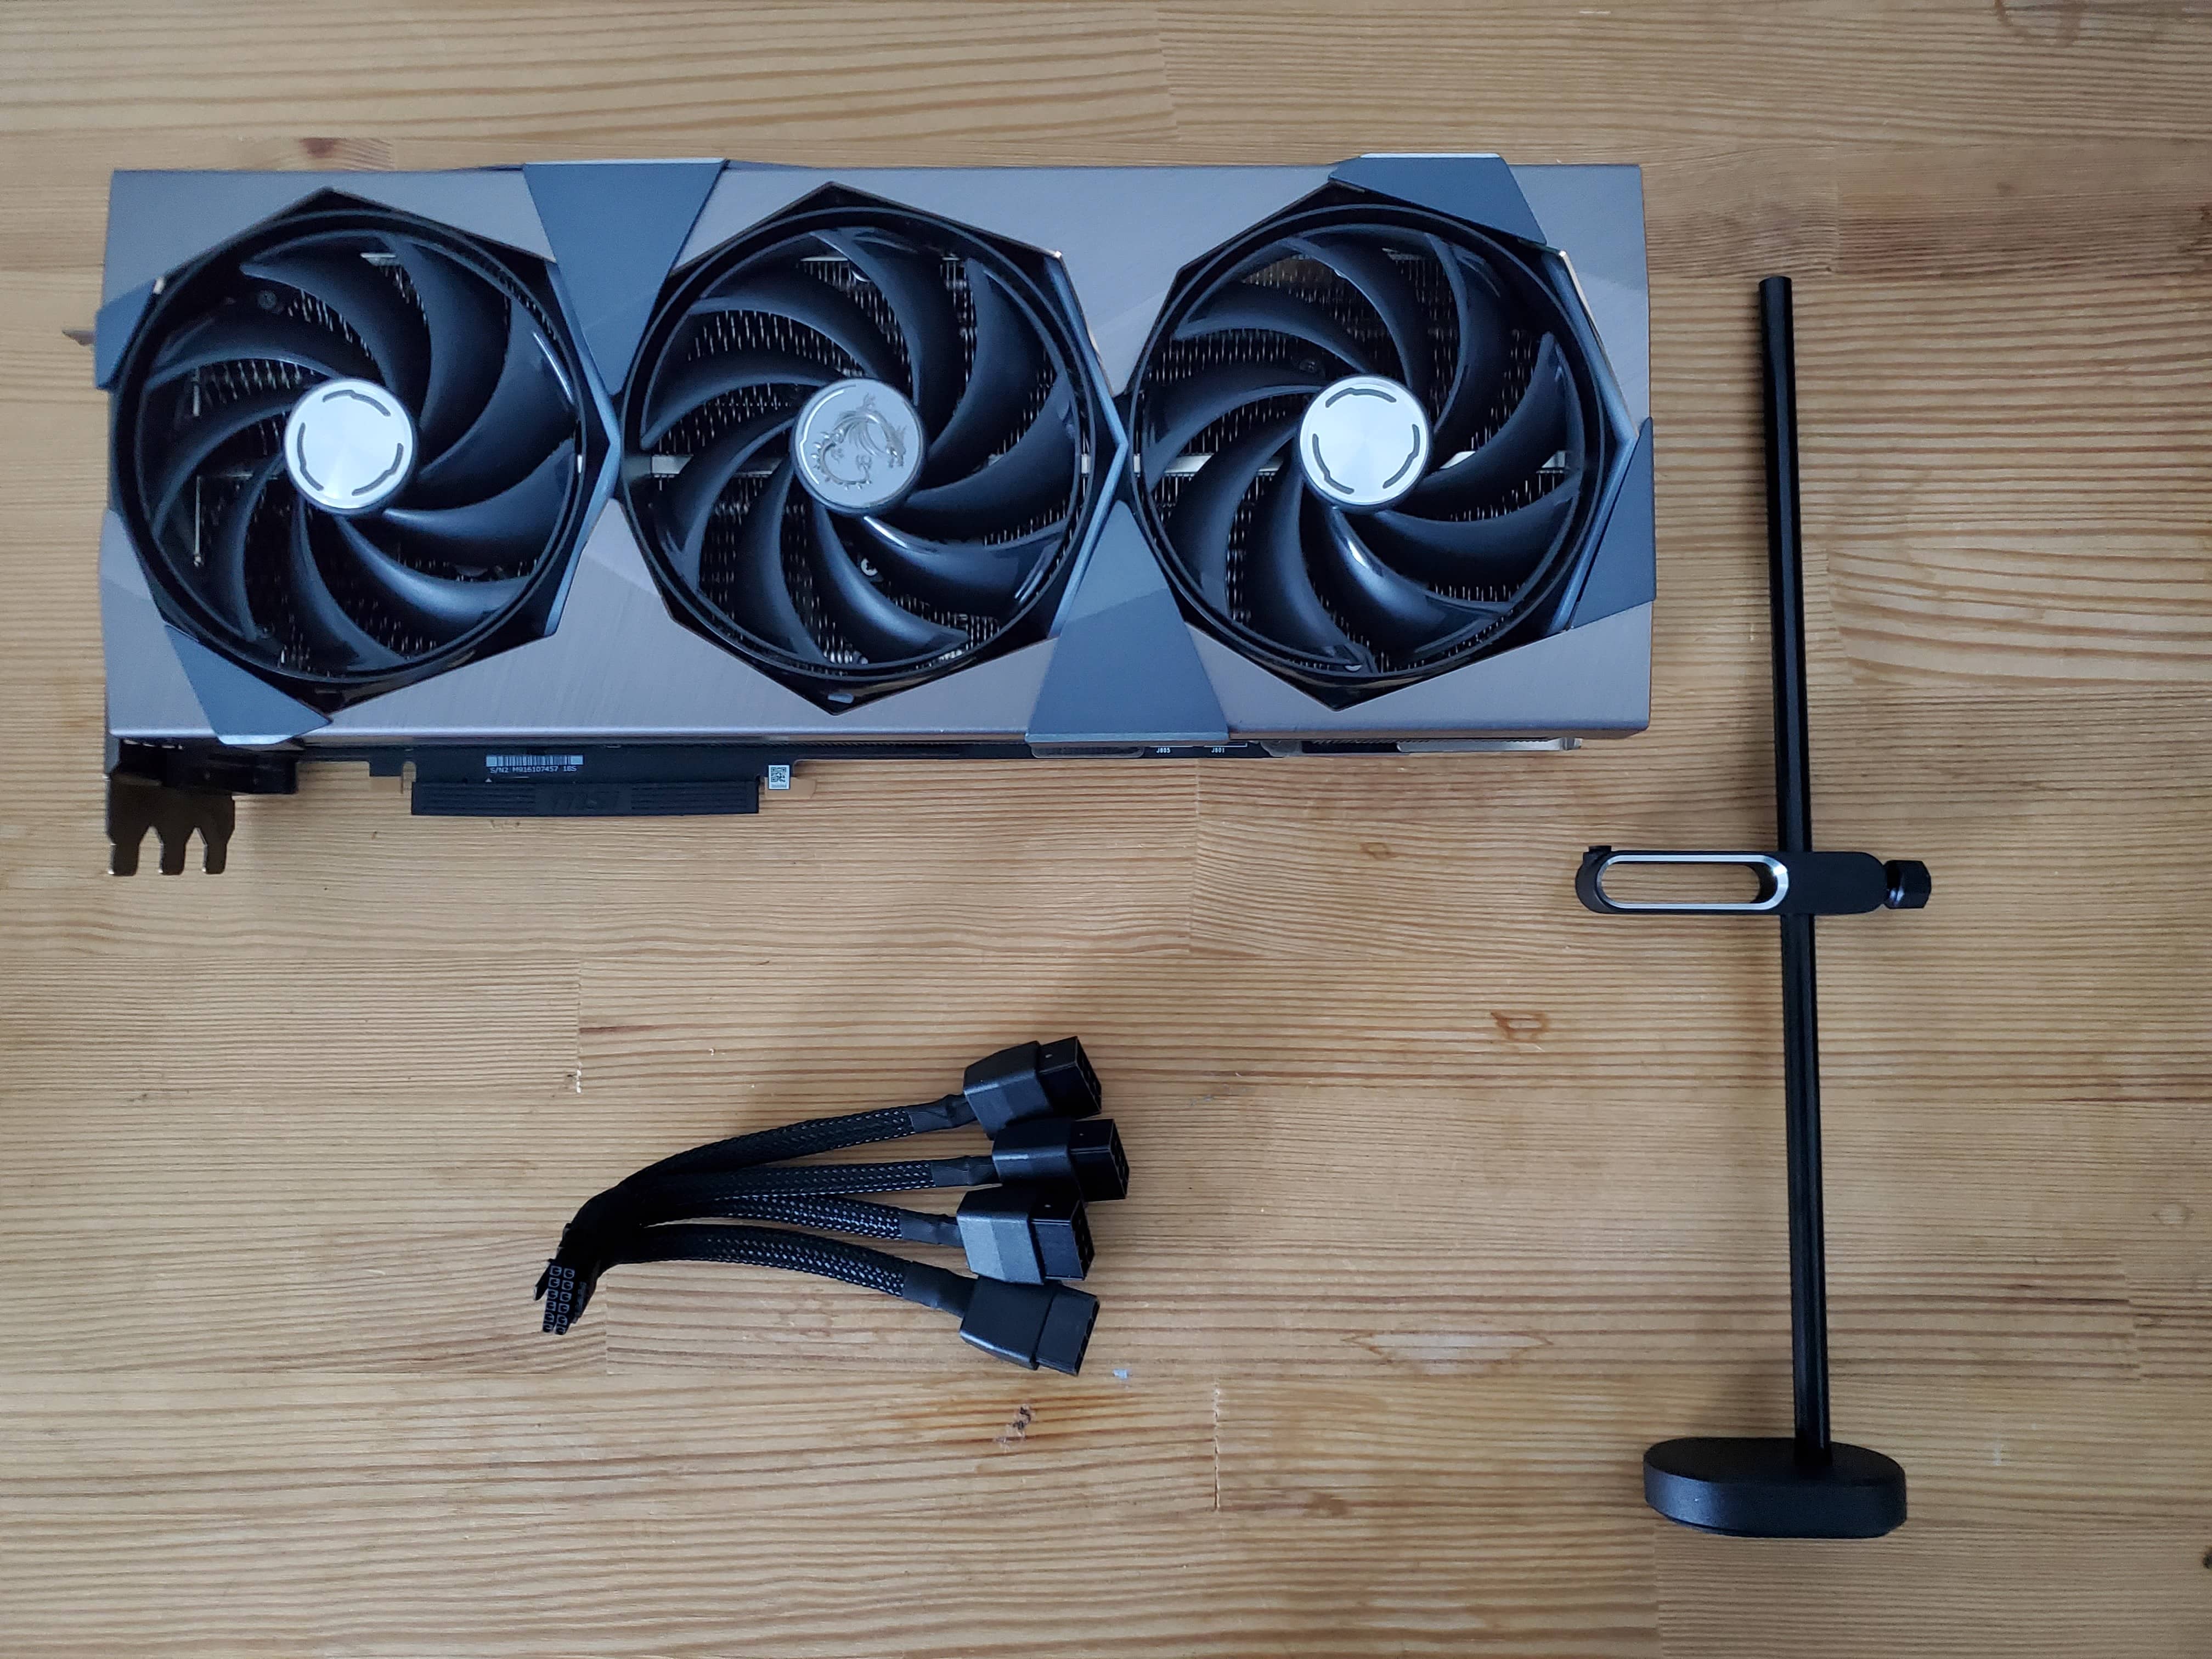
MSI GEFORCE RTX 4090 SUPRIM X 24 GB , an overview of this video card on our website is available at the following link .
This video card is currently one of the most productive graphics solutions. Received the highest performance rating of 100% in our test, but has the lowest optimal FPS/$ ratio : for 1920x1080 it is 69 , for 2560x1440 it is 64 and for 3840x2160 it is 41 .
| MSI GEFORCE RTX 4080 SUPRIM X 16 GB
1
1
1
1
1
1
1
1
1
1
Rating 75% [6 Votes]
|
MSI GEFORCE RTX 4080 SUPRIM X 16 GB , an overview of this video card on our website is available at the following link .
This video card is currently the second most productive solution in terms of rating. Received a performance rating of 86% for 1920x1080 , 79% for 2560x1440 and 76% for 3840x2160 in our test.
It has the following FPS / $ optimality coefficients : for 1920x1080 it is 106 , for 2560x1440 it is 81 and for 3840x2160 it is 50 .
| ASUS Radeon RX 7900 XTX 1 1 1 1 1 1 1 1 1 1 Rating 66% [9 Votes] |

ASUS Radeon RX 7900 XTX , an overview of this video card on our website is available at the following link .
This video card is currently the second most productive solution in terms of rating. Received a performance rating of 81% for 1920x1080 , 77% for 2560x1440 and 73% for 3840x2160 in our test.
It has the following FPS / $ optimality coefficients : for 1920x1080 it is 113 , for 2560x1440 it is 86 and for 3840x2160 it is 54 .
| ASUS TUF Gaming Radeon RX 7900 XT OC Edition 20GB
1
1
1
1
1
1
1
1
1
1
Rating 86% [7 Votes]
|
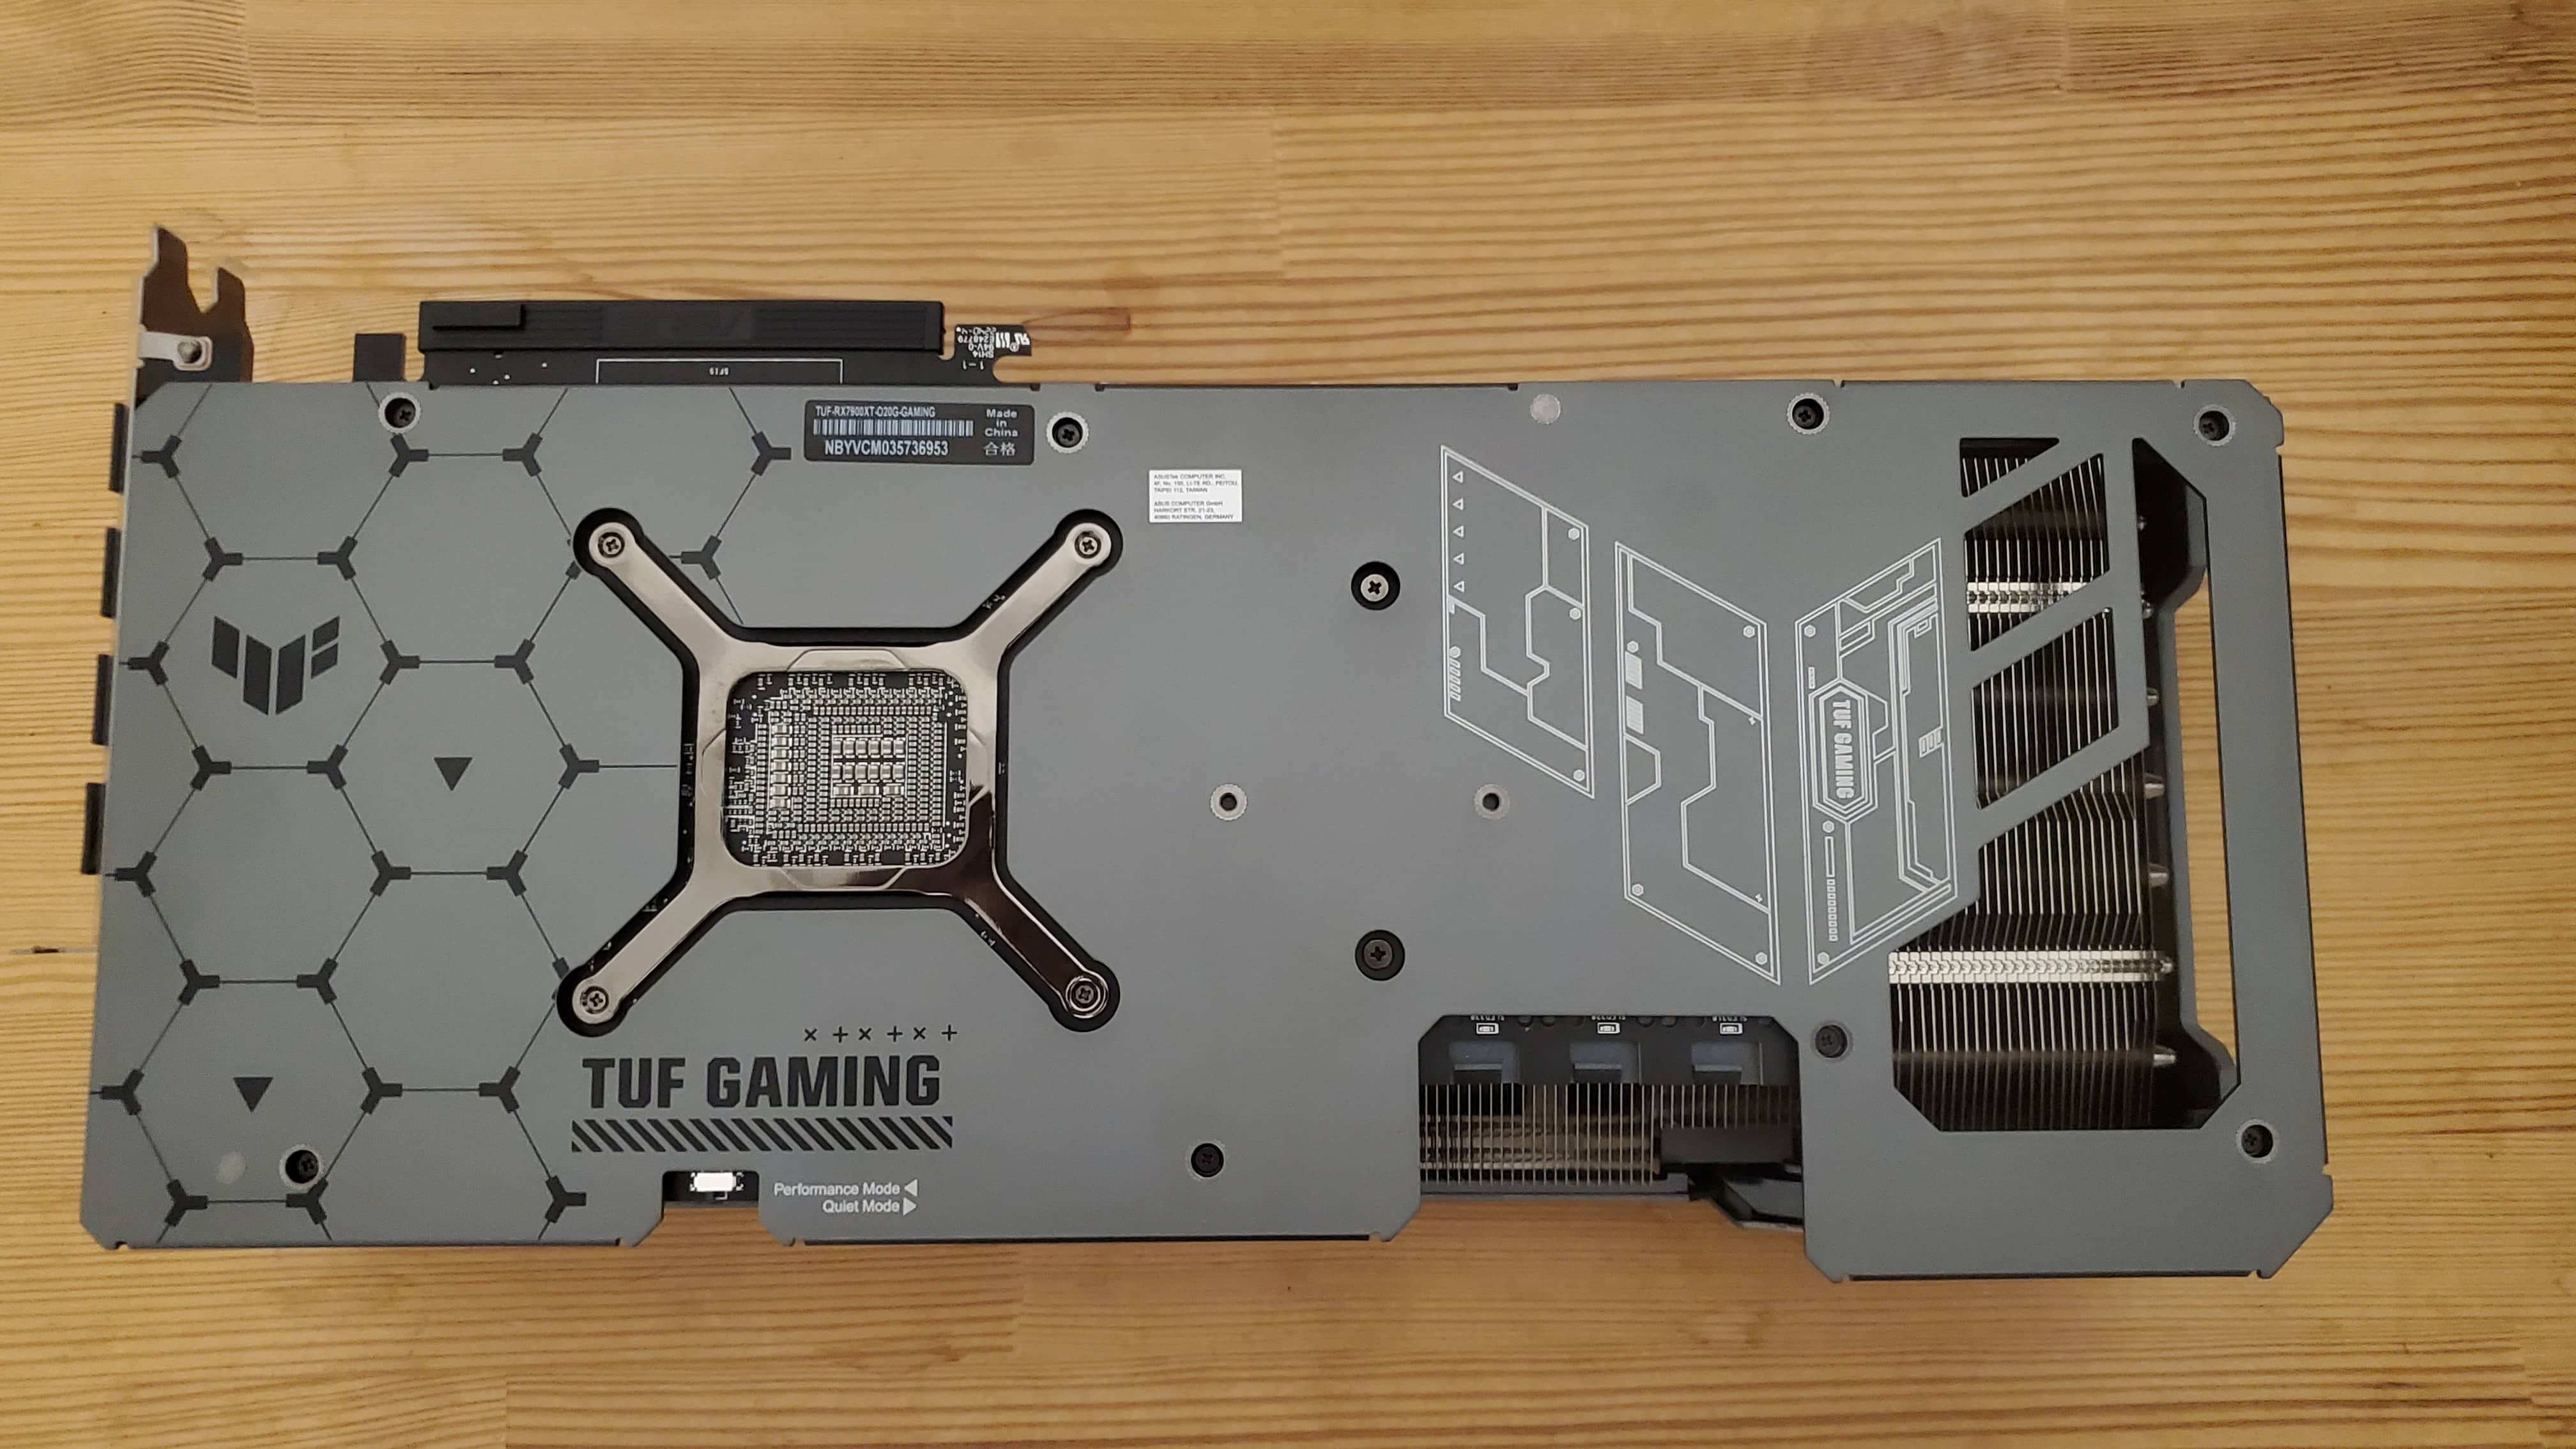
ASUS TUF Gaming Radeon RX 7900 XT OC Edition 20GB , a review of this video card on our website is available at the following link .
This video card is currently the second most productive solution in terms of rating. Received a performance rating of 71% for 1920x1080 , 66% for 2560x1440 and 61% for 3840x2160 in our test.
It has the following FPS / $ optimality coefficients : for 1920x1080 it is 113 , for 2560x1440 it is 86 and for 3840x2160 it is 53 .
| ASUS TUF Gaming GeForce RTX 4070 Ti OC
1
1
1
1
1
1
1
1
1
1
Rating 83% [6 Votes]
|
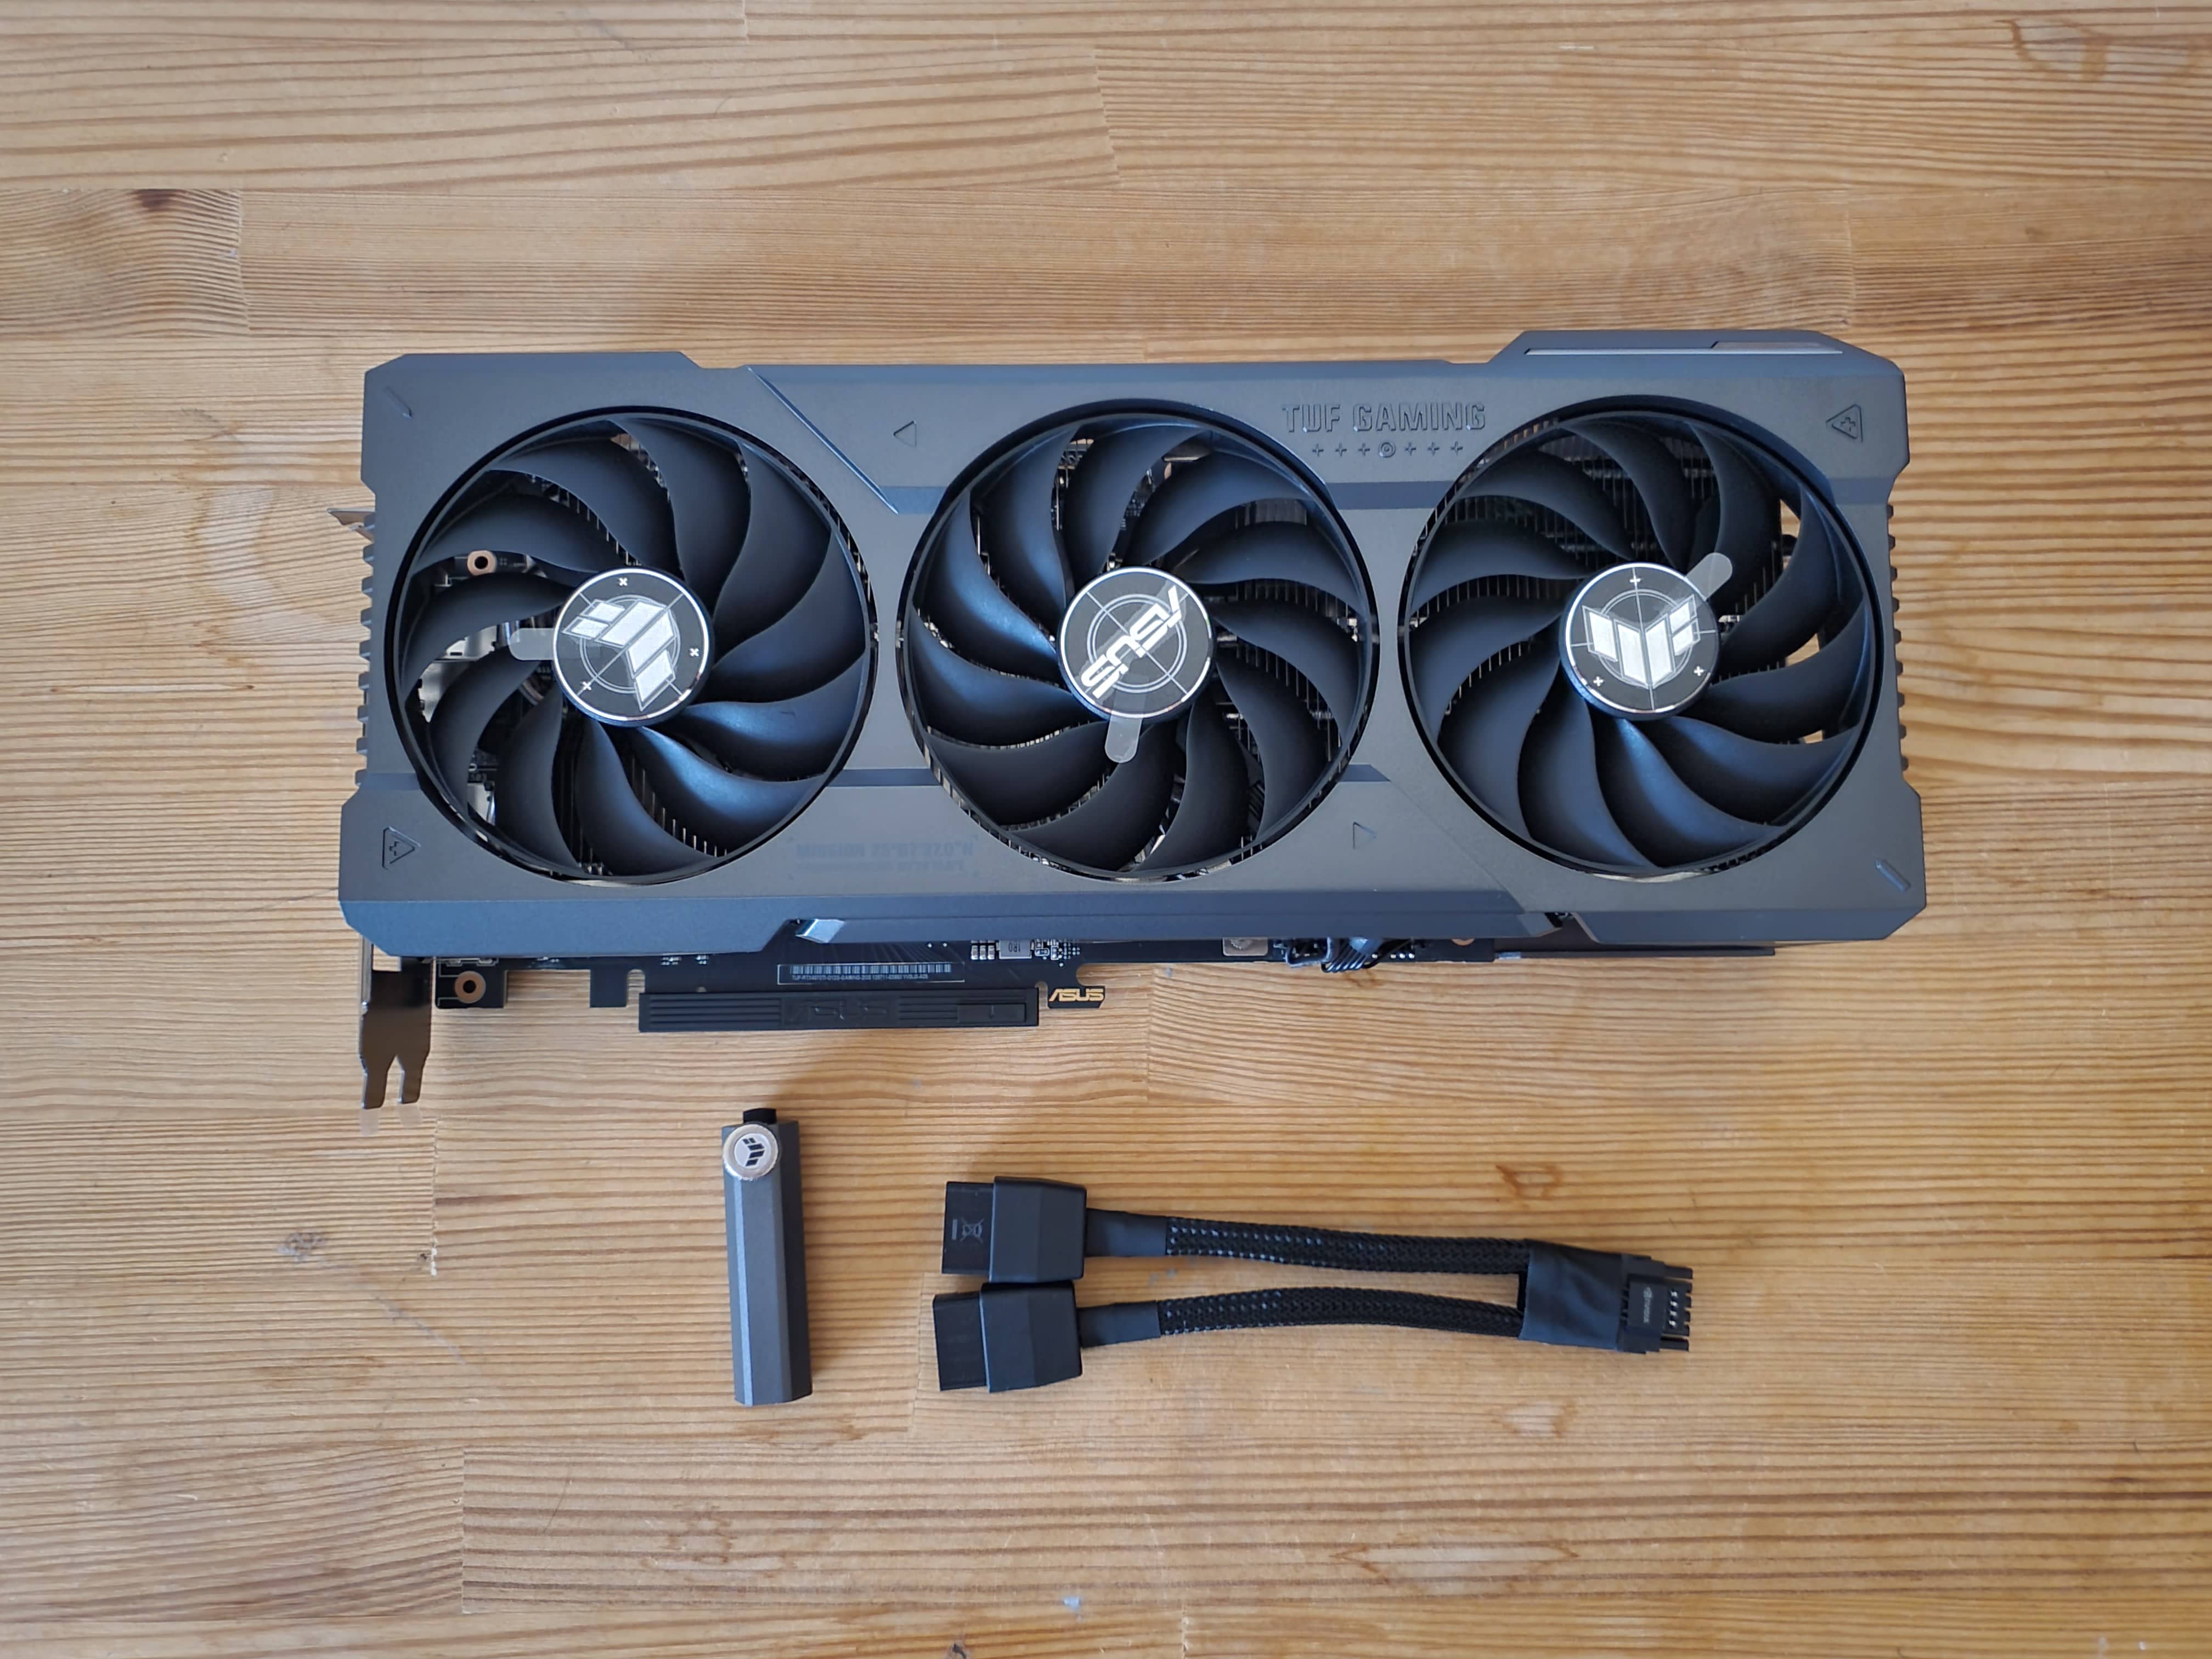
ASUS TUF Gaming GeForce RTX 4070 Ti OC , a review of this video card on our website is available at the following link .
This video card is currently the second most productive solution in terms of rating. Received a performance rating of 70% for 1920x1080 , 66% for 2560x1440 and 61% for 3840x2160 in our test.
It has the following optimal FPS / $ coefficients : for 1920x1080 it is 125 , for 2560x1440 it is 98 and for 3840x2160 it is 58 .
Well, we express our deep gratitude to our partners represented by GIGABYTE, MSI, ASUS and KINGSTON without which this annual testing would be simply impossible!
| OUR SPONSORS |
 |
 |
| |
| |
![]()