


Starfield v. 1.8.86 DLSS Test and PC Performance Benchmarks for Graphics Cards and Processors
| BASIC GAME INFORMATION |
We tested the beta version of Starfield at the highest graphics settings, on video cards from the GEFORCE RTX and RADEON RX series with DLSS and FSR. Also, during the tests we conducted, we assessed the performance and quality of the graphic display of the game itself.
| NEW PRODUCTS PROVIDED FOR TESTS BY MSI |
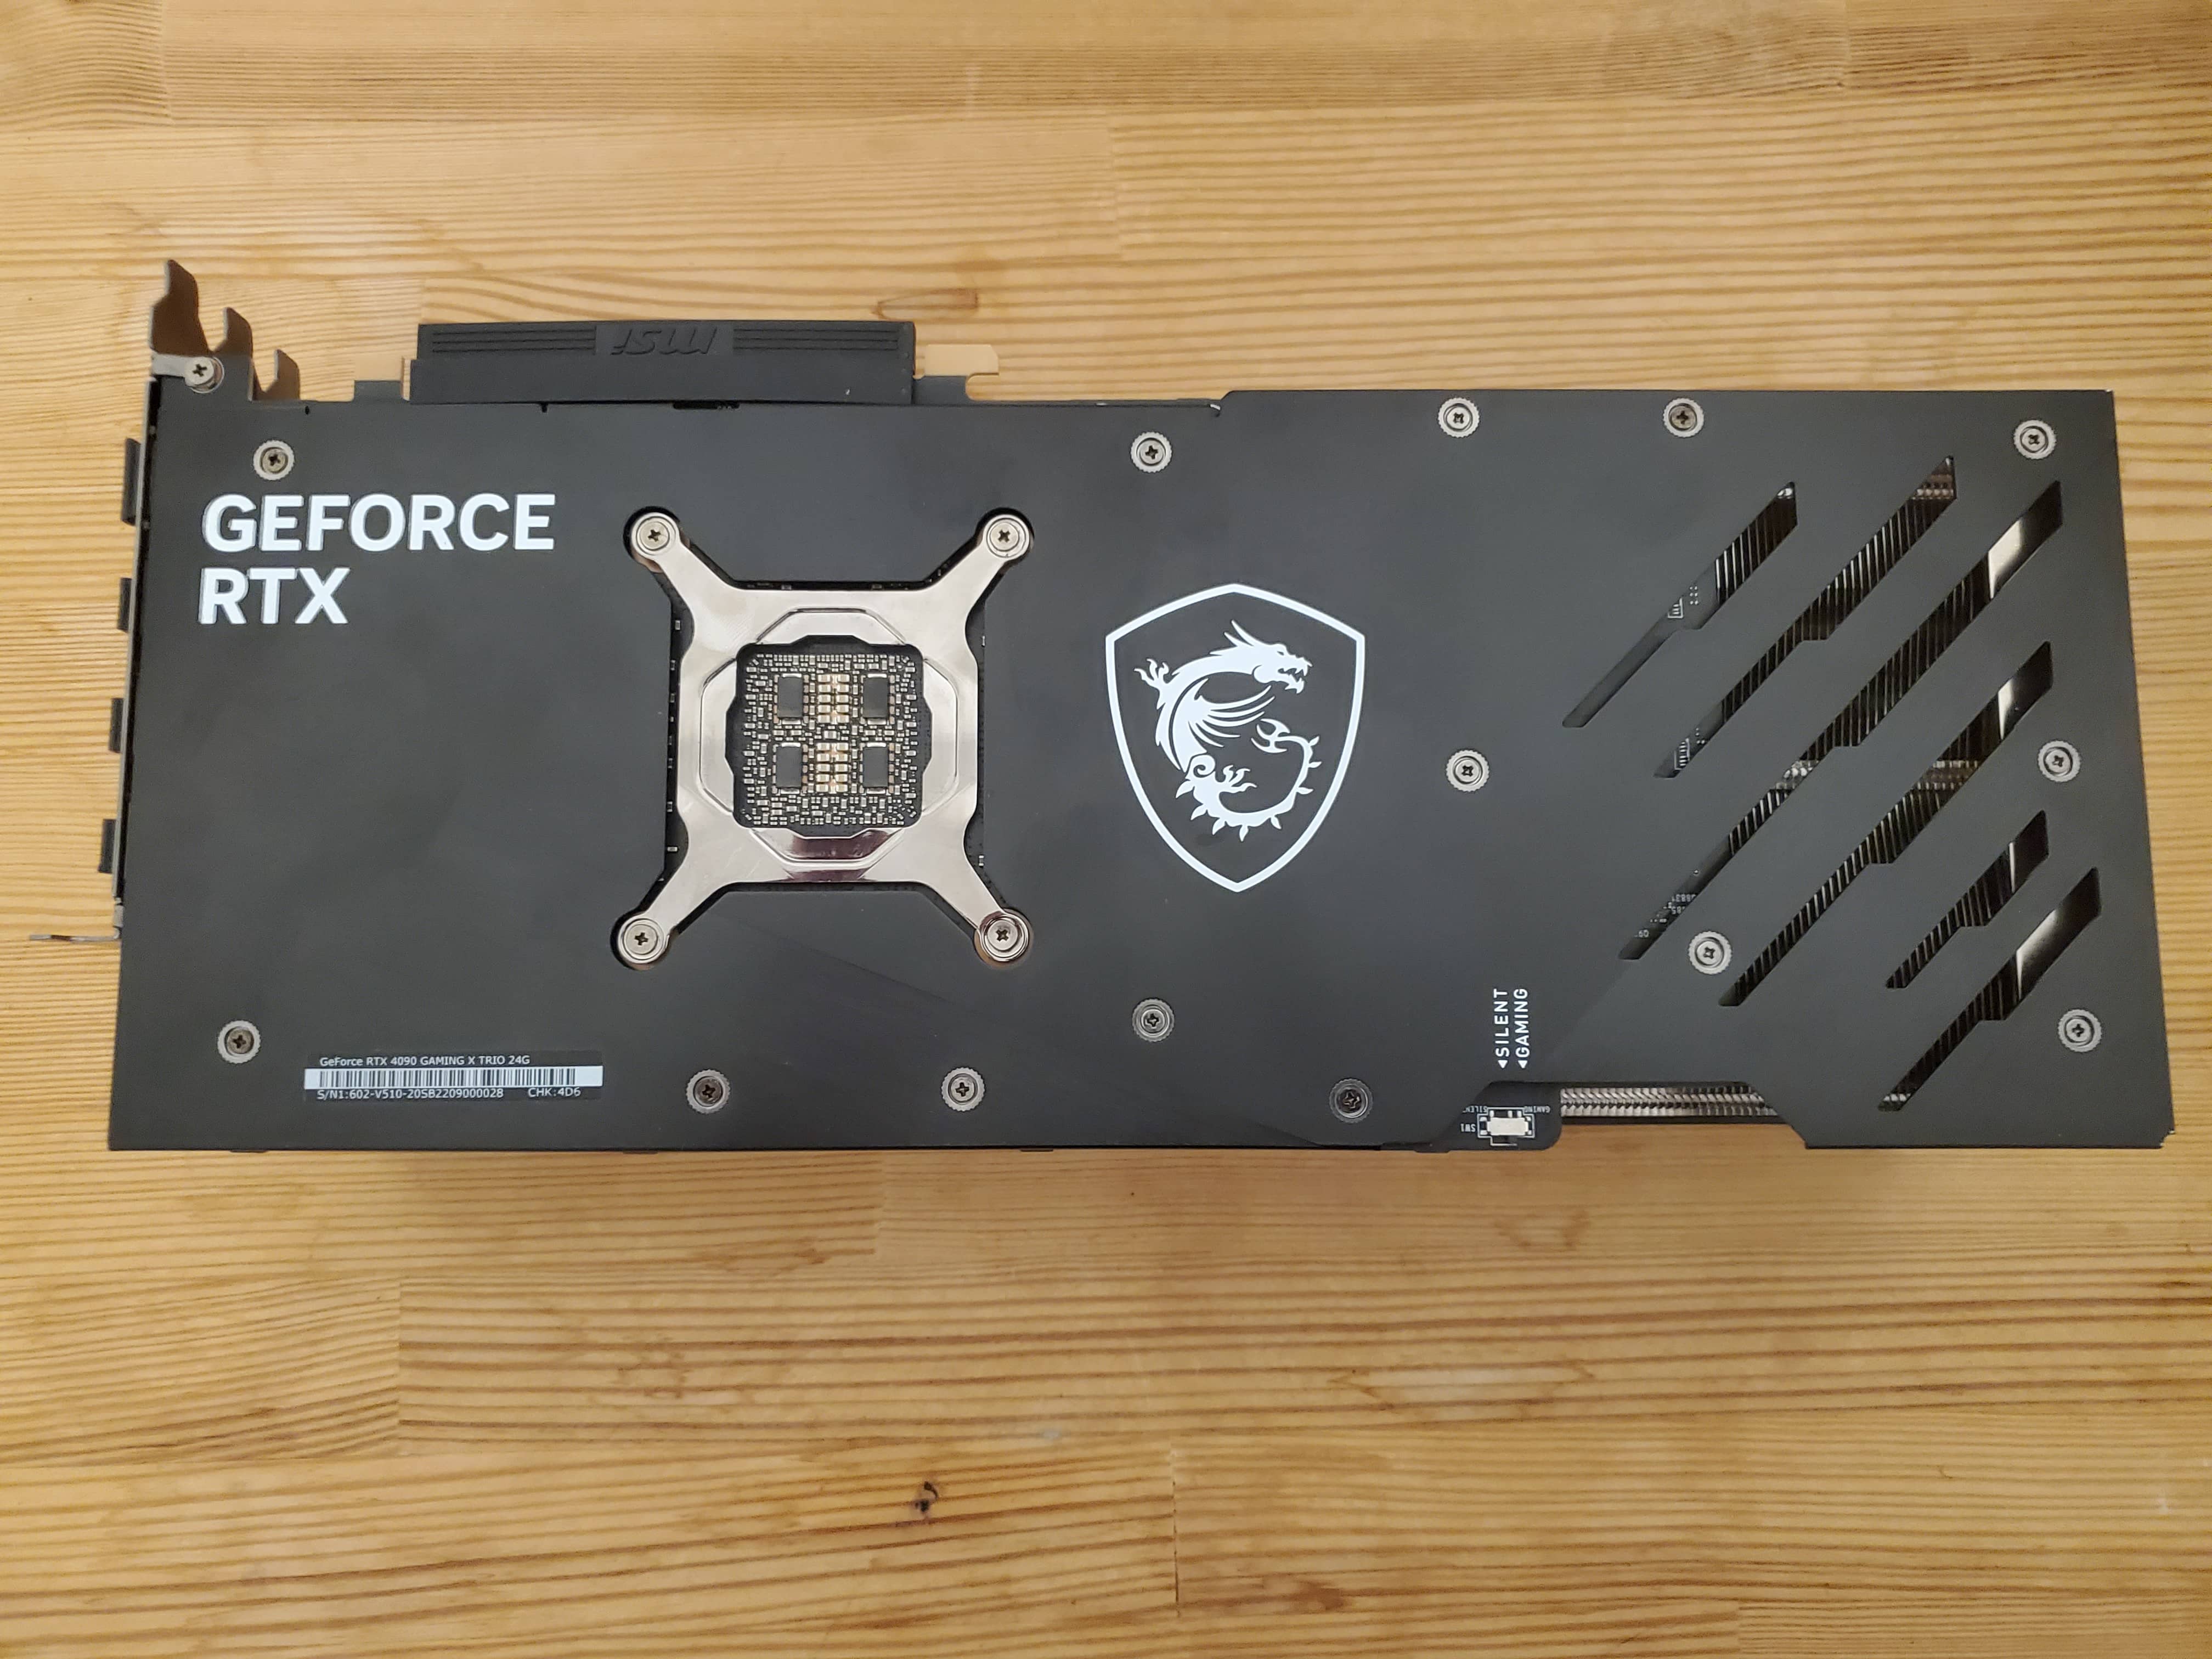
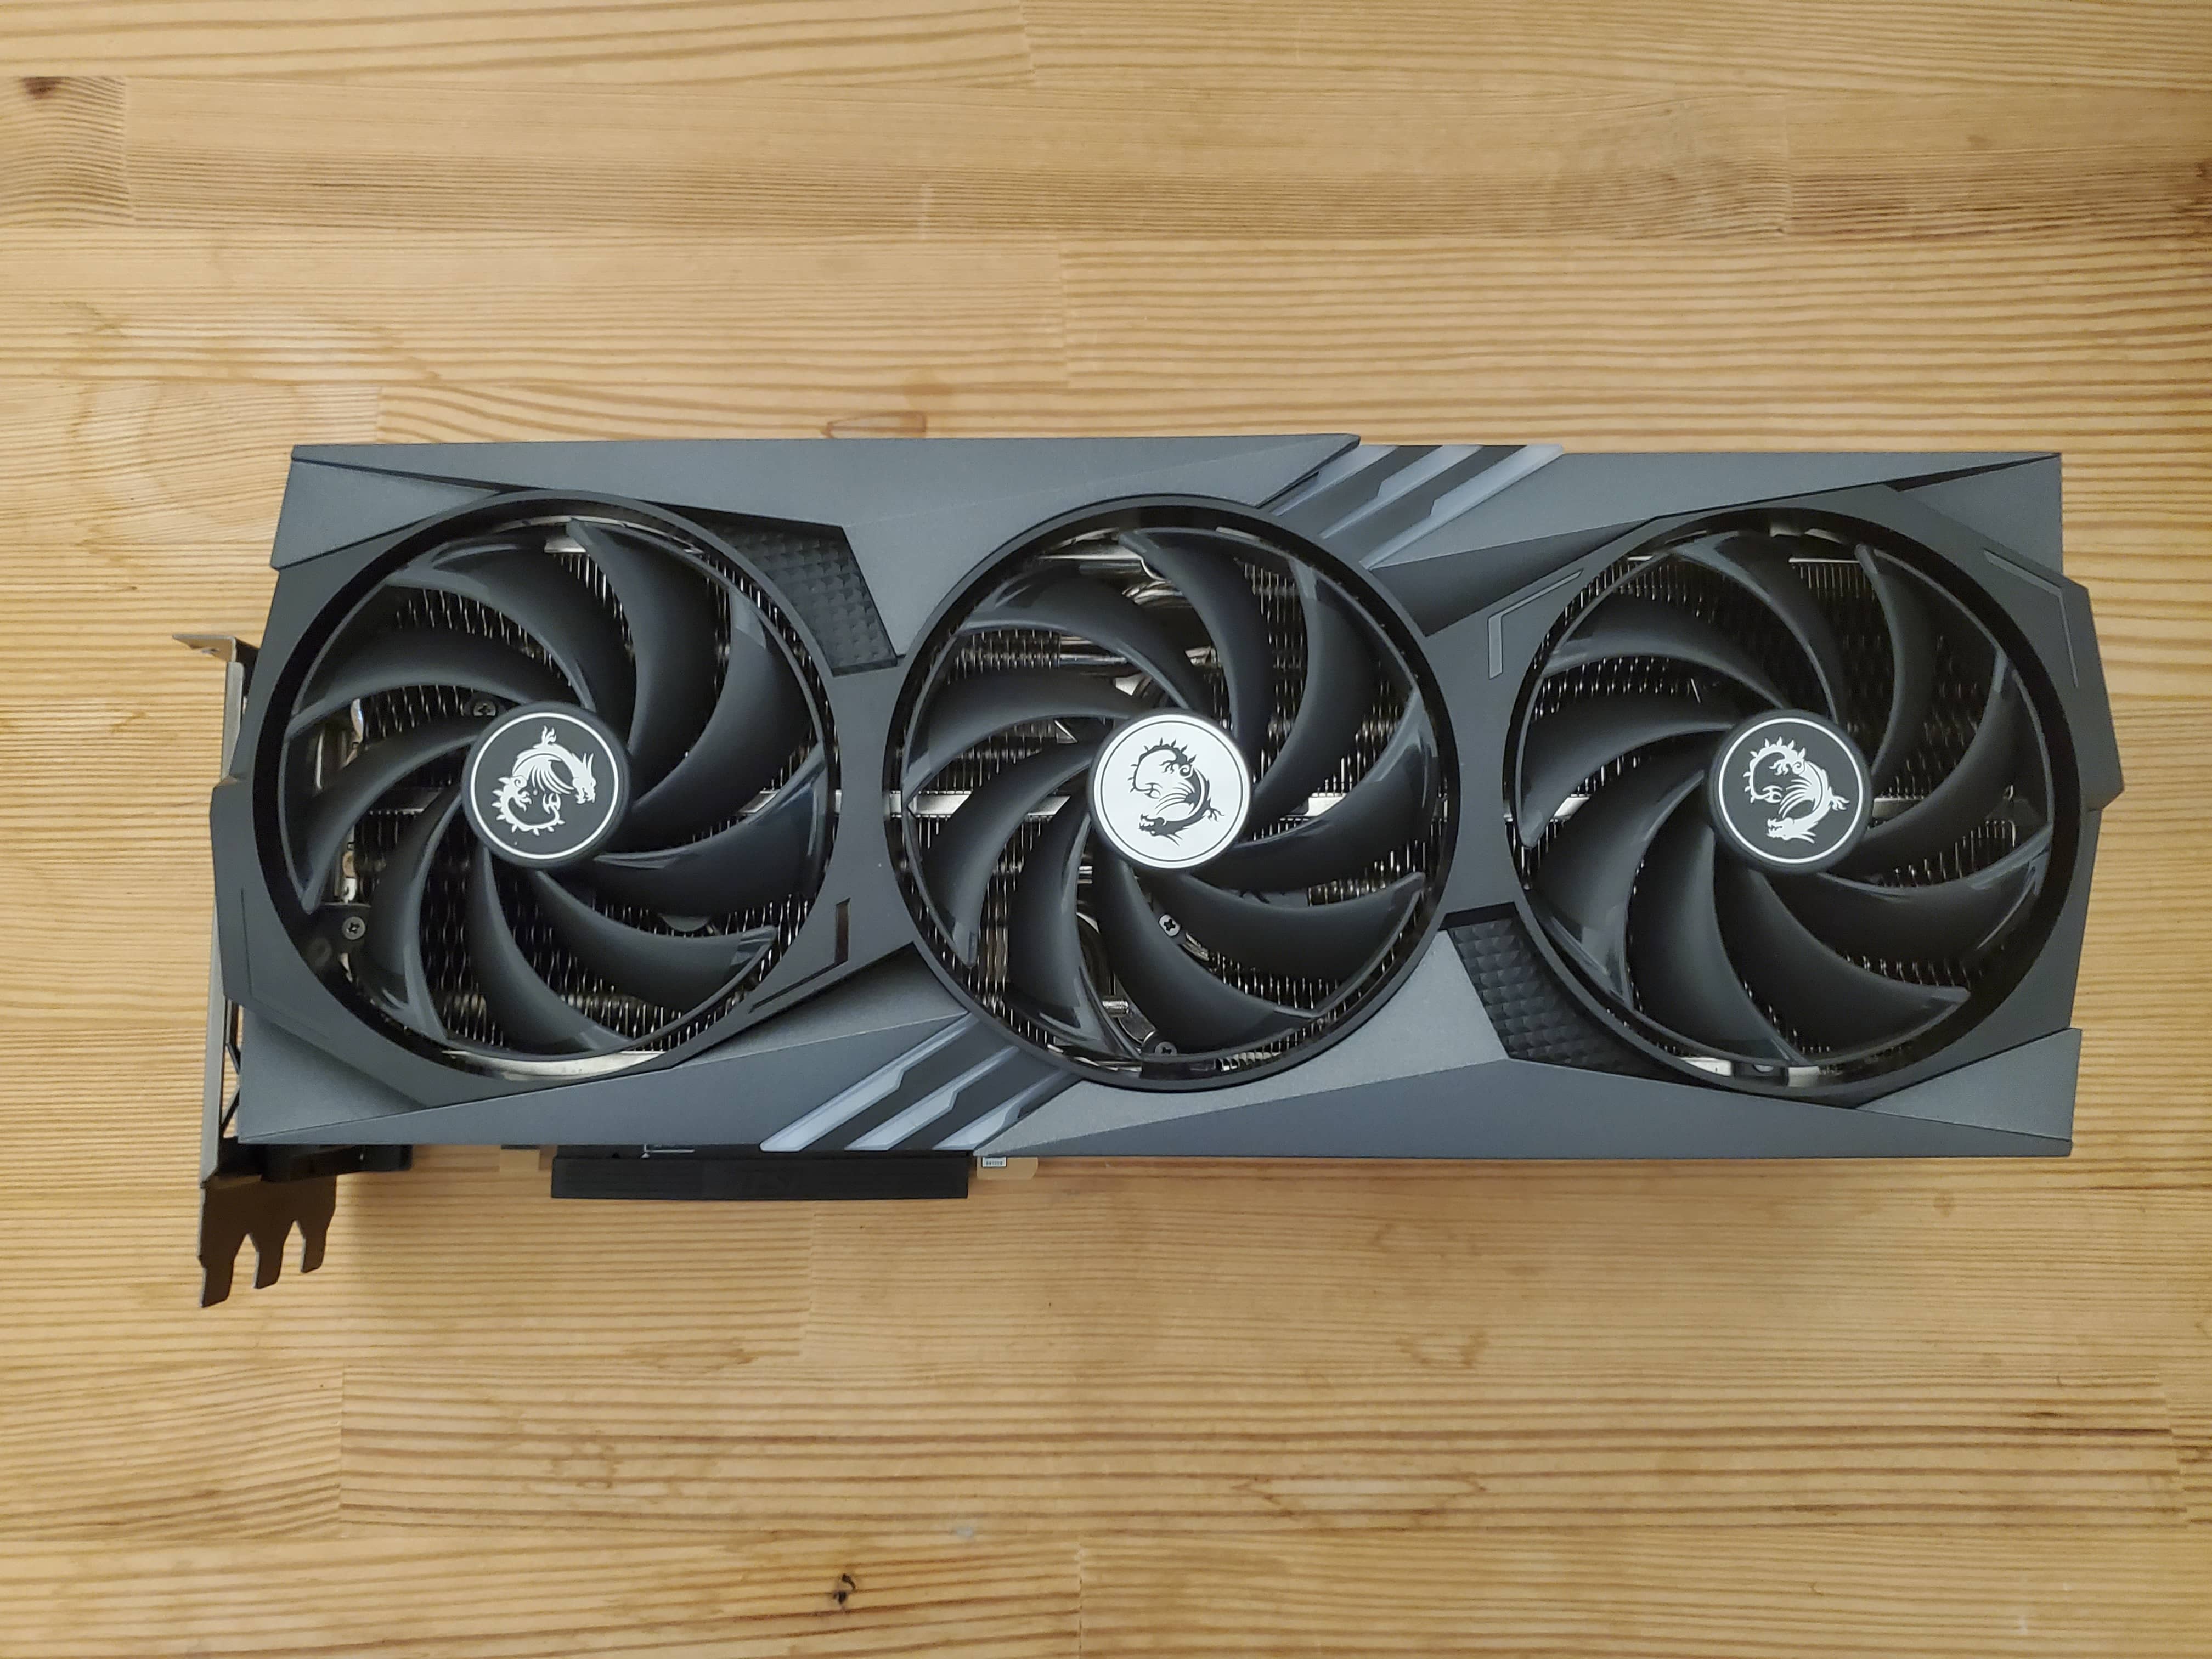
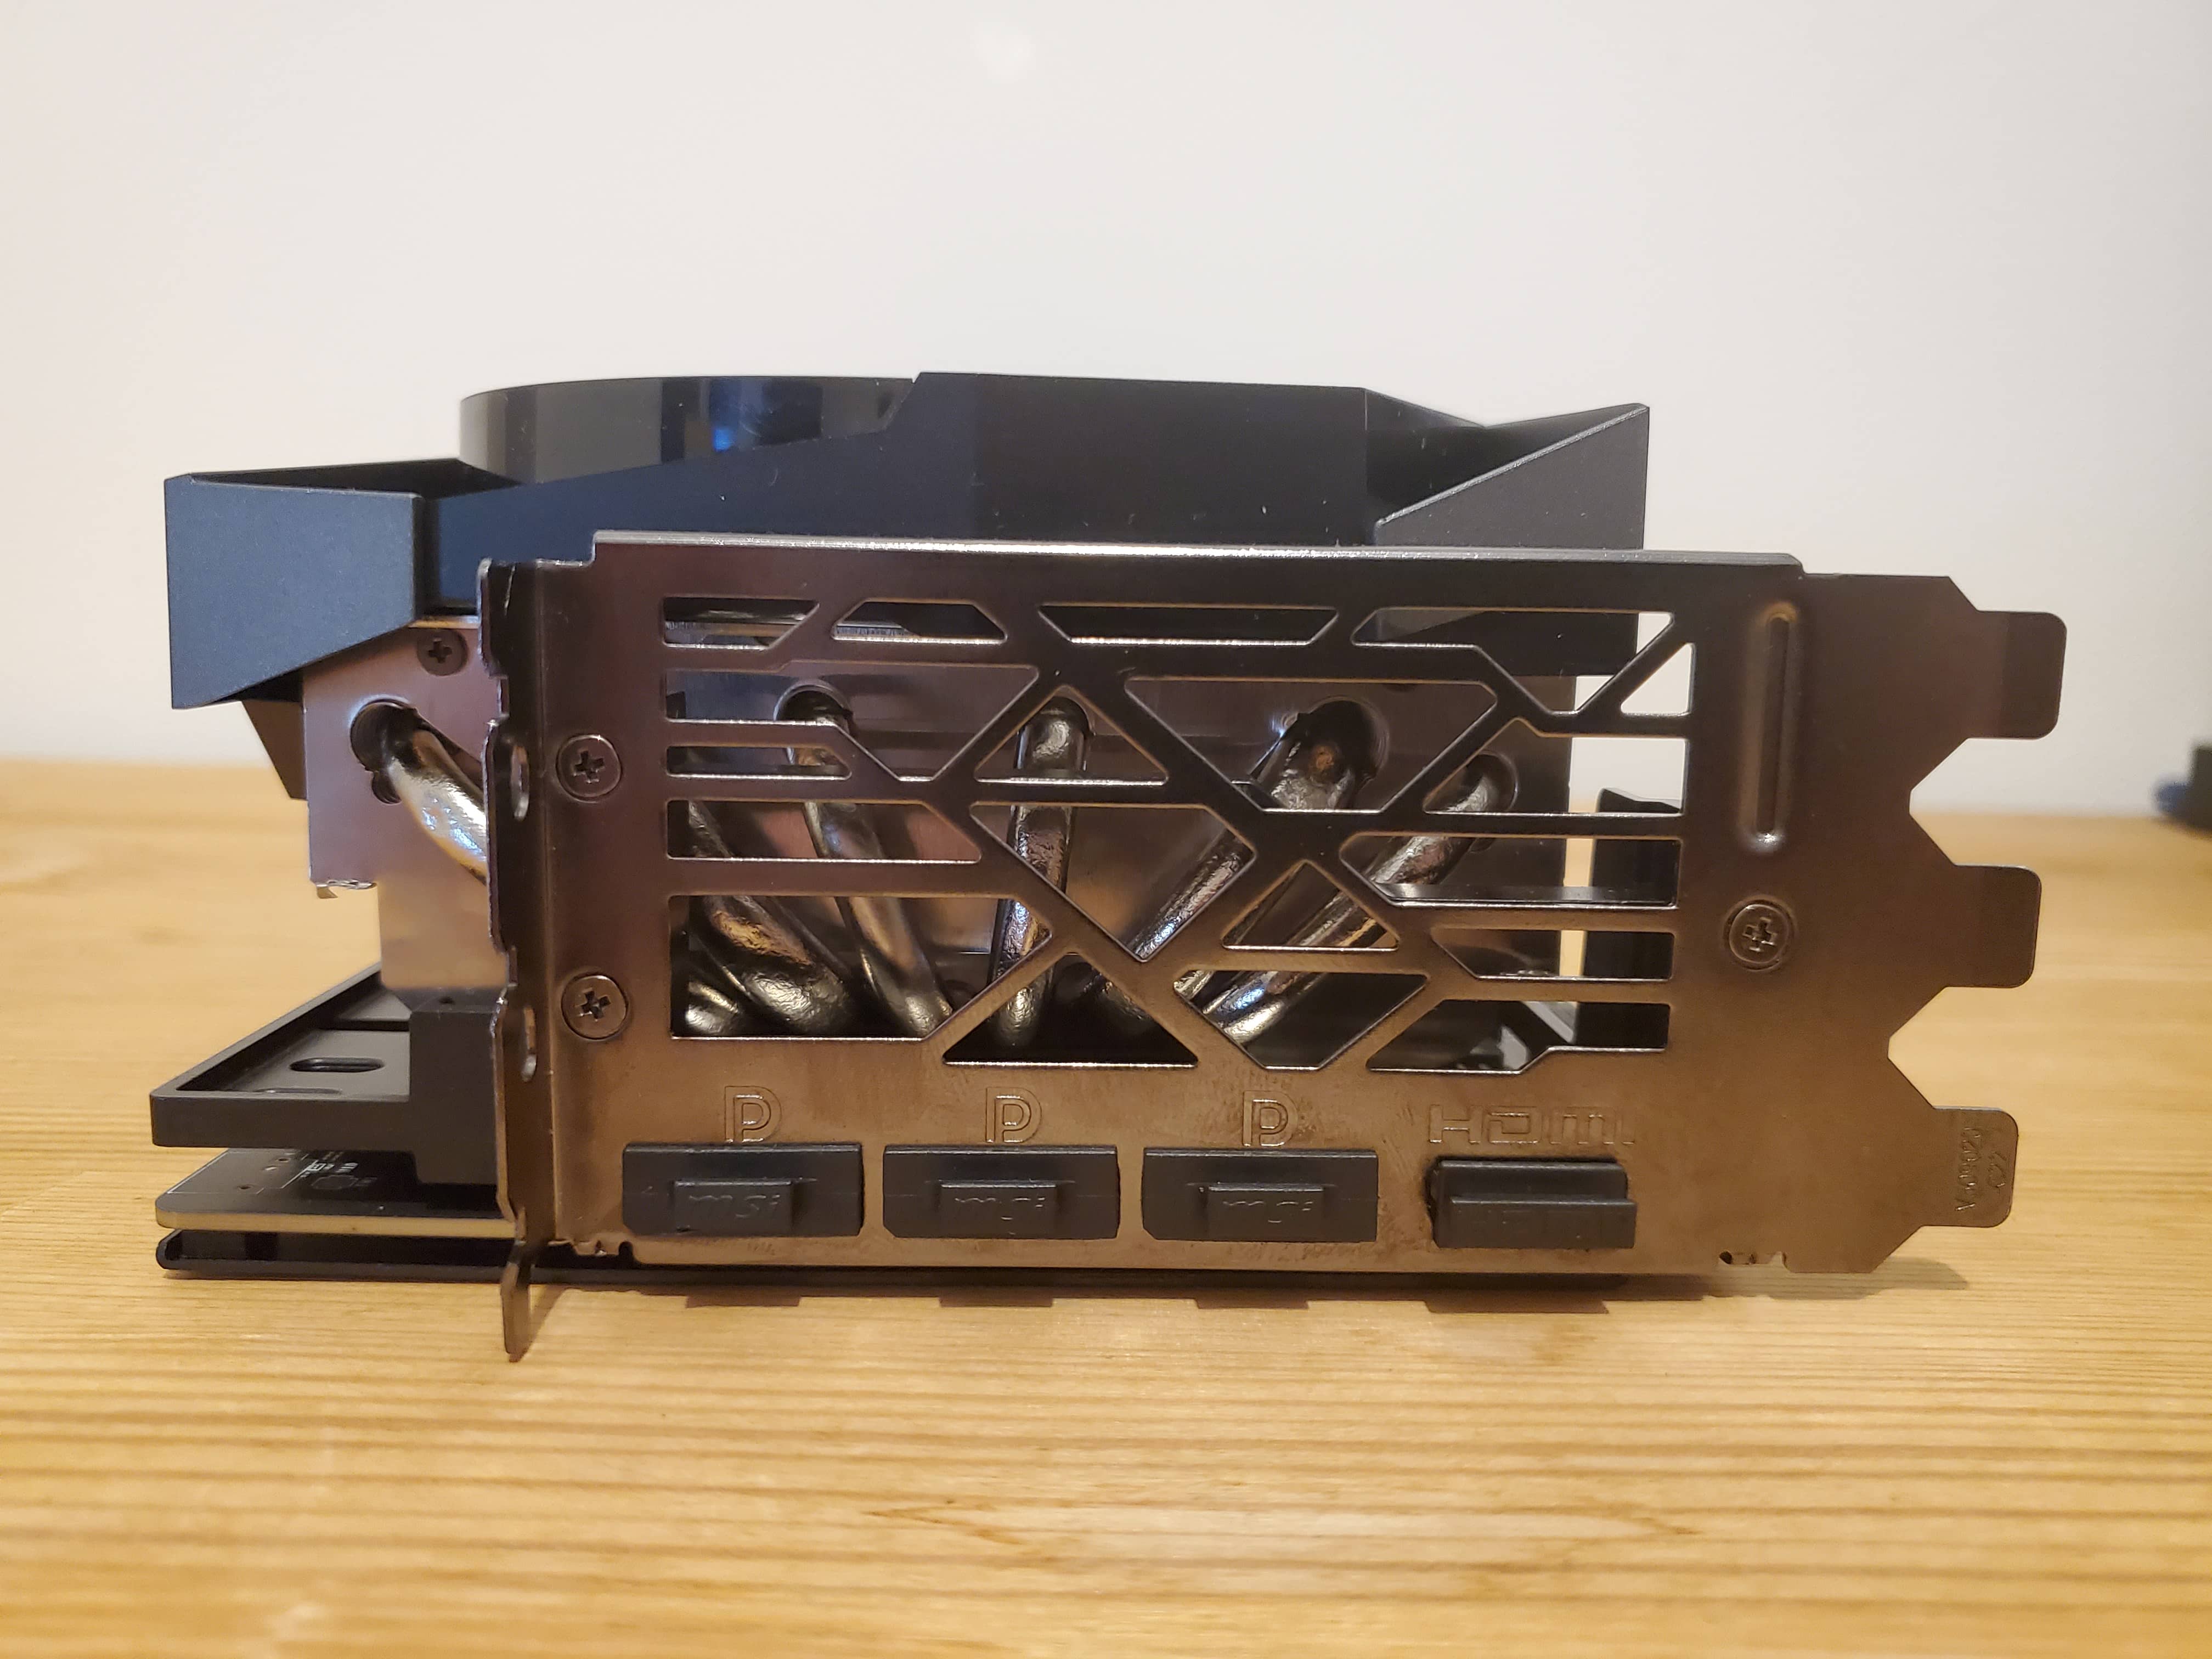
Our test now includes the MSI GEFORCE RTX 4090 GAMING X TRIO 24 GB .This video card is based on the Ada Lovelace architecture, operates at a frequency of 2750 MHz, has 16384 stream processors and 24 gigabytes of video memory.
| NEW PRODUCTS PROVIDED FOR TESTS BY ASUS |
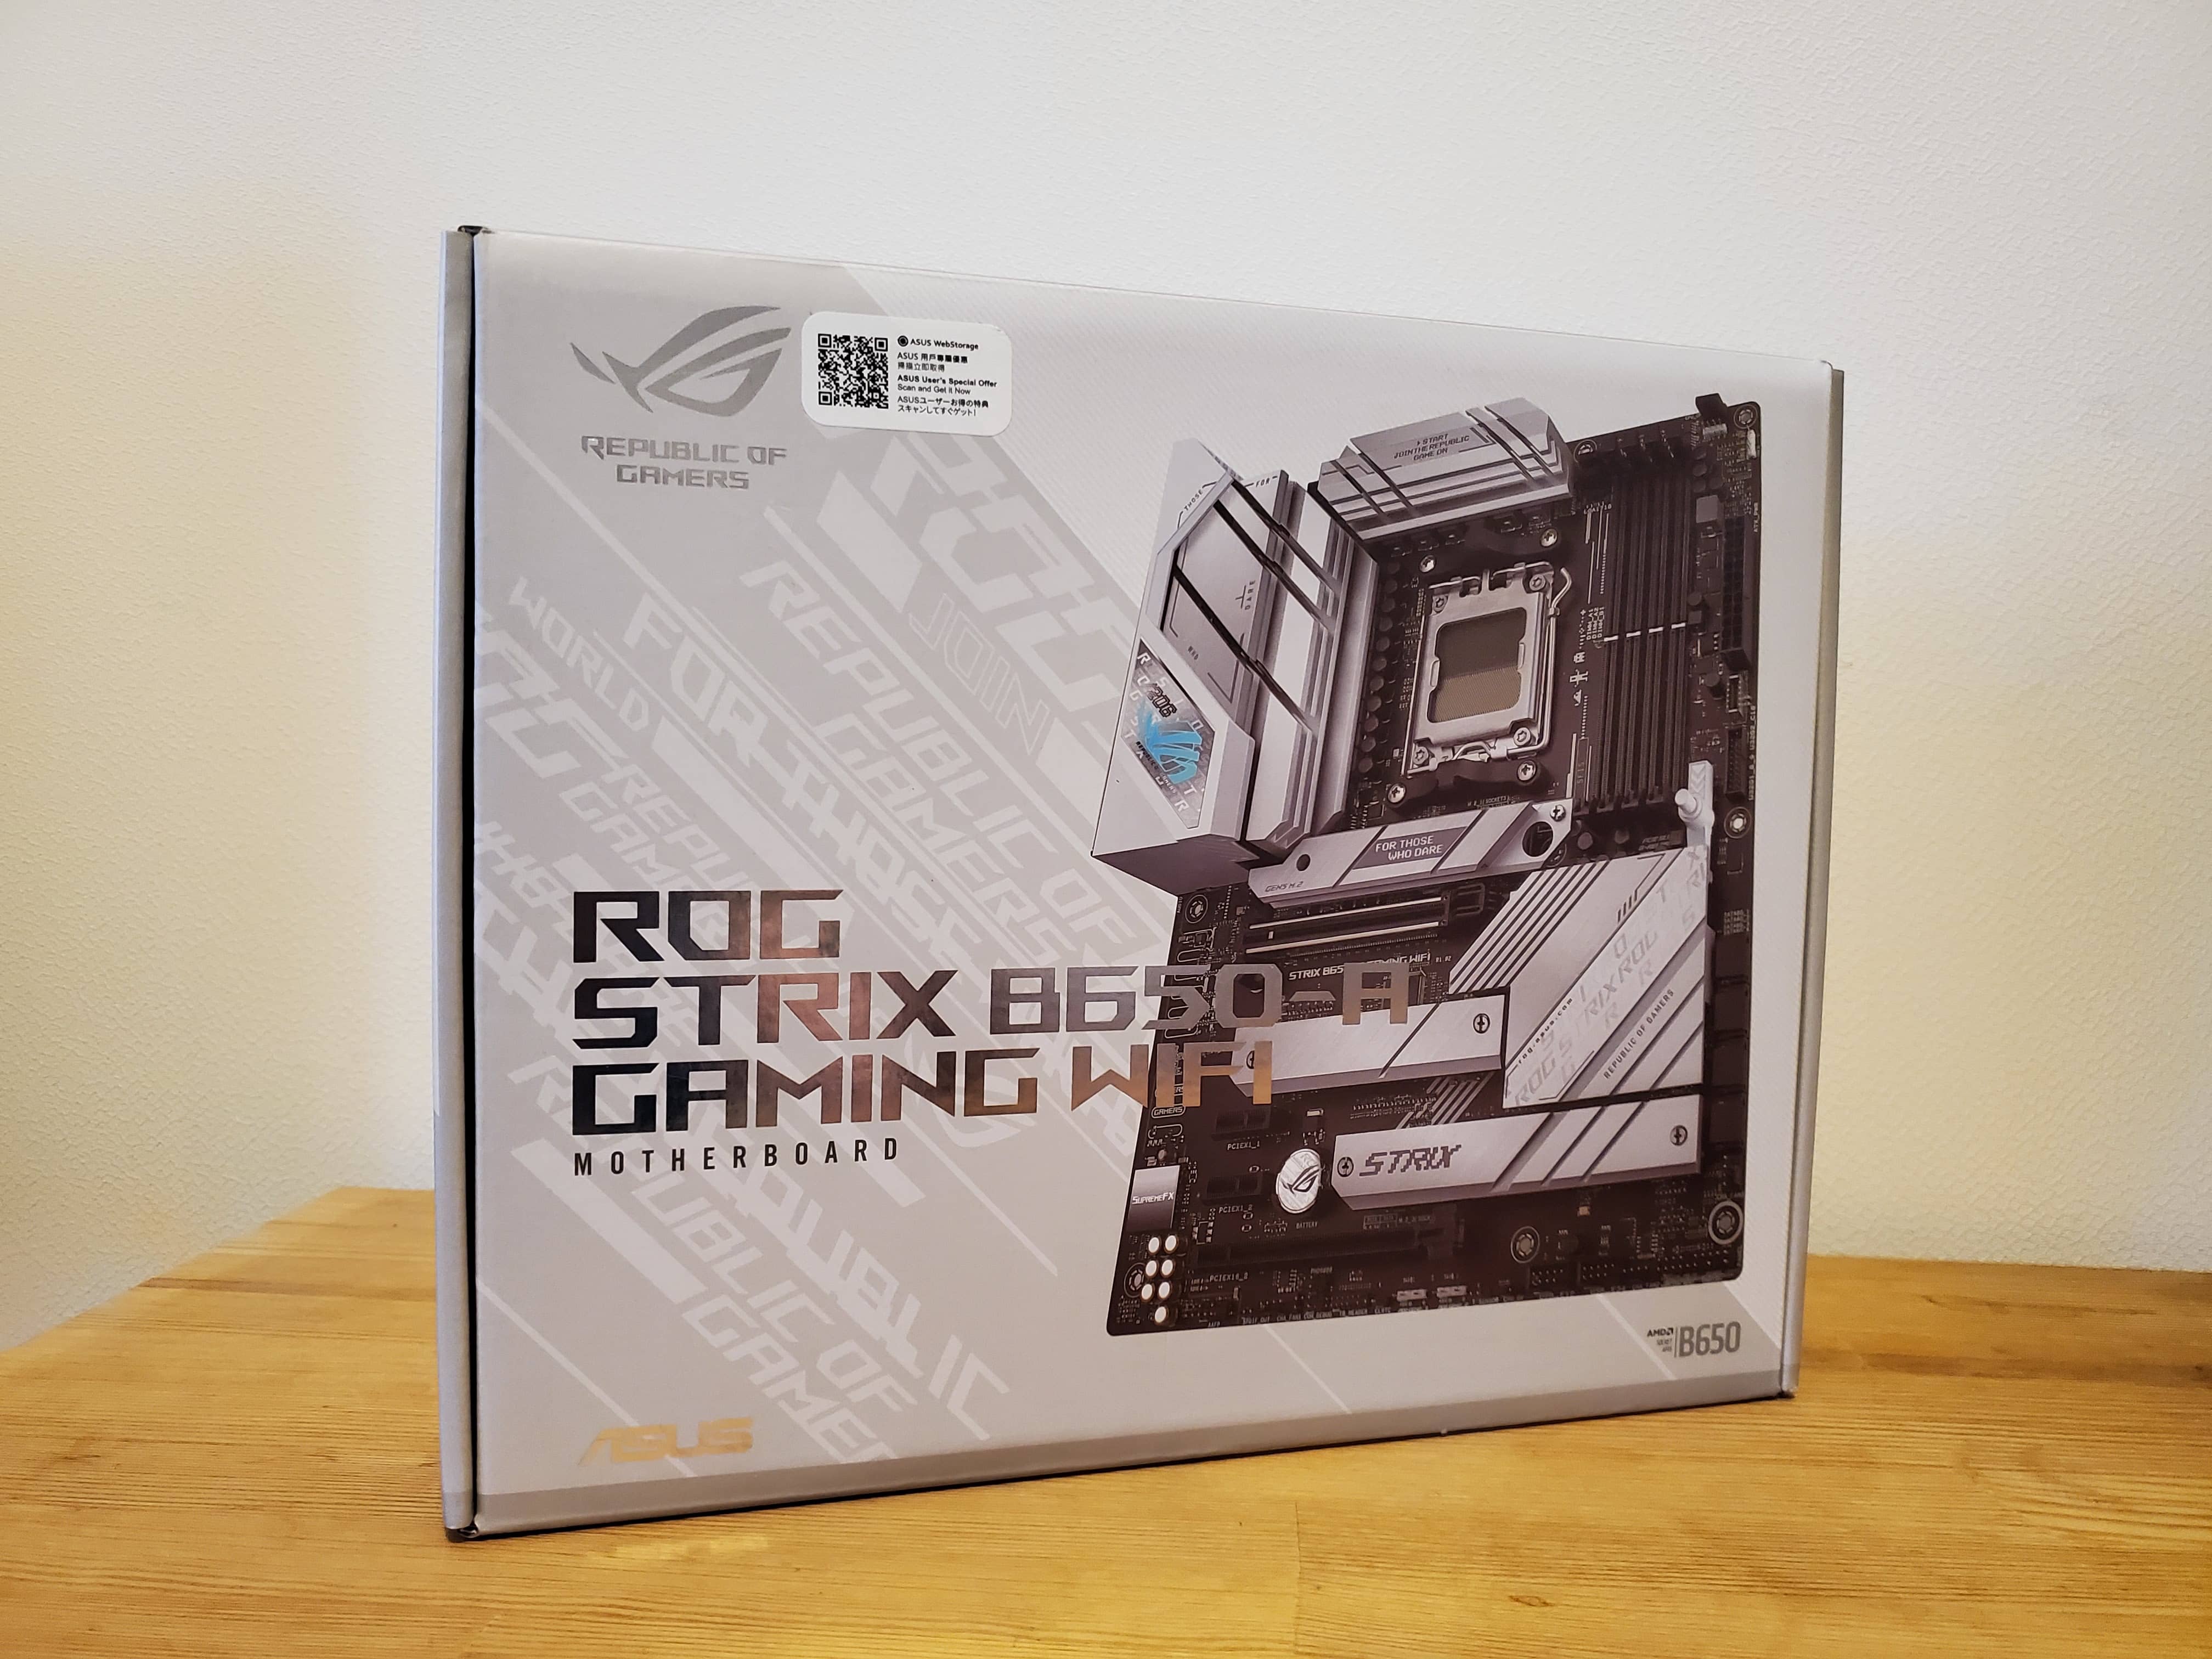
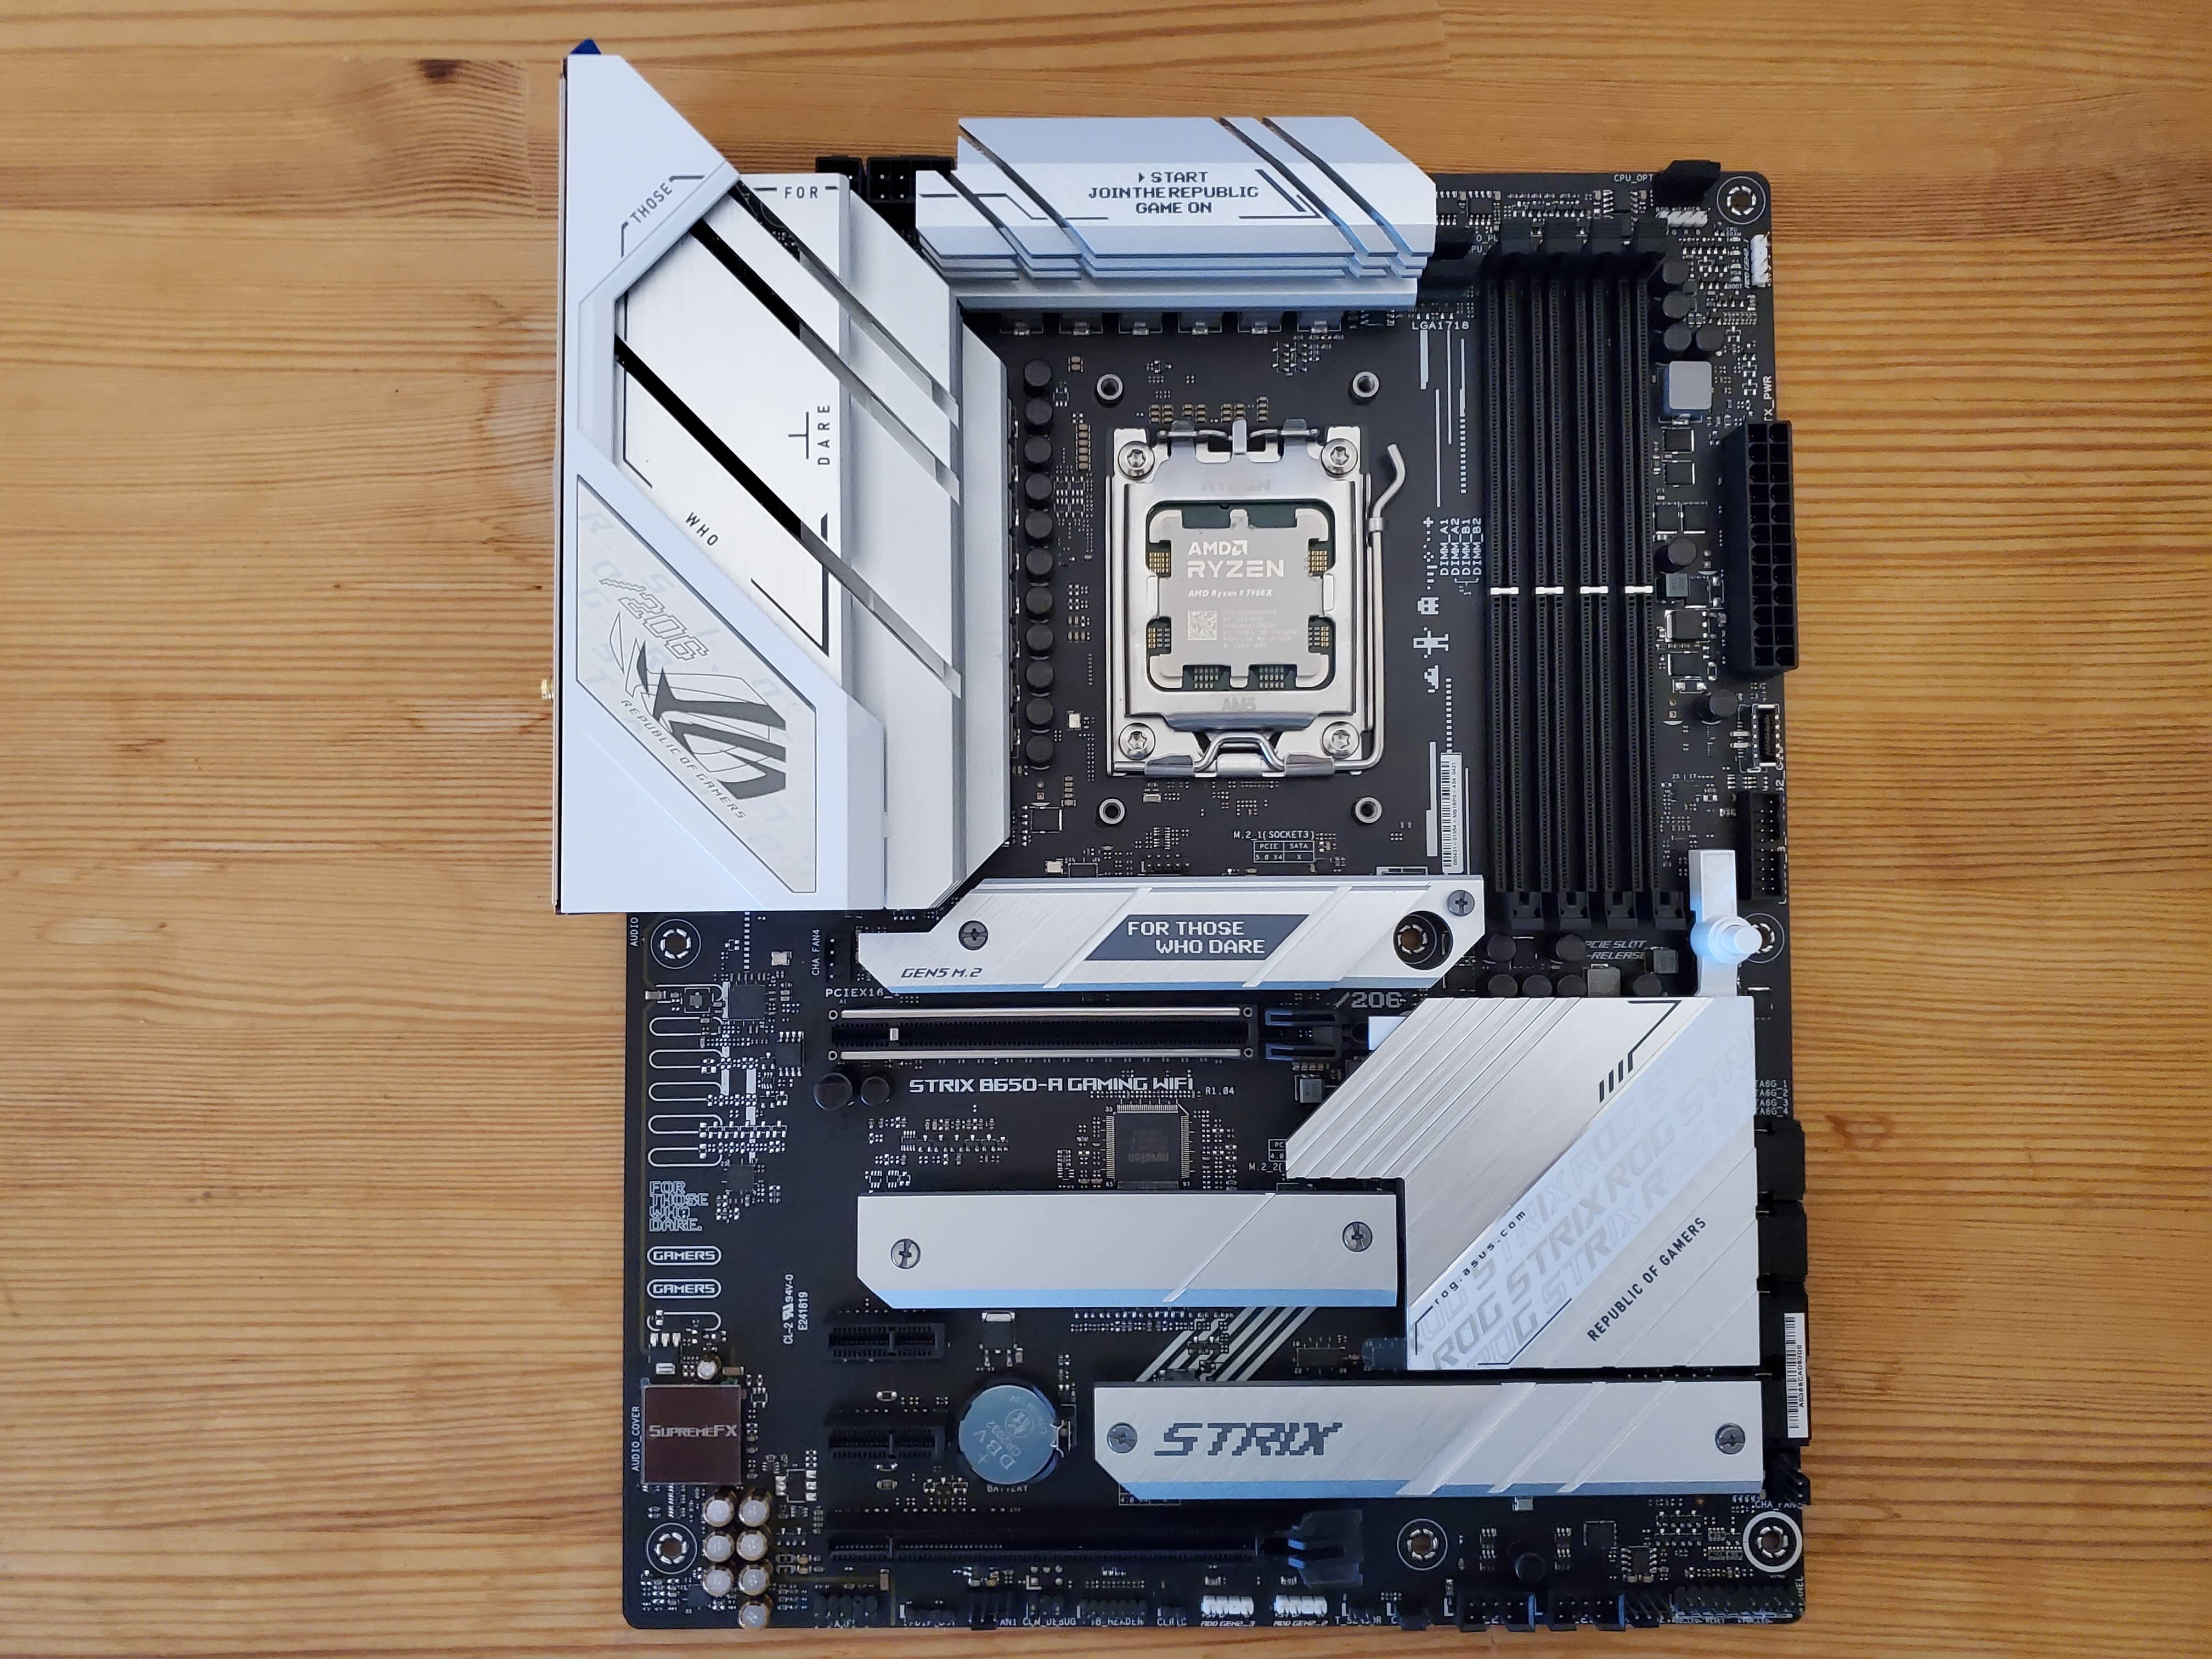
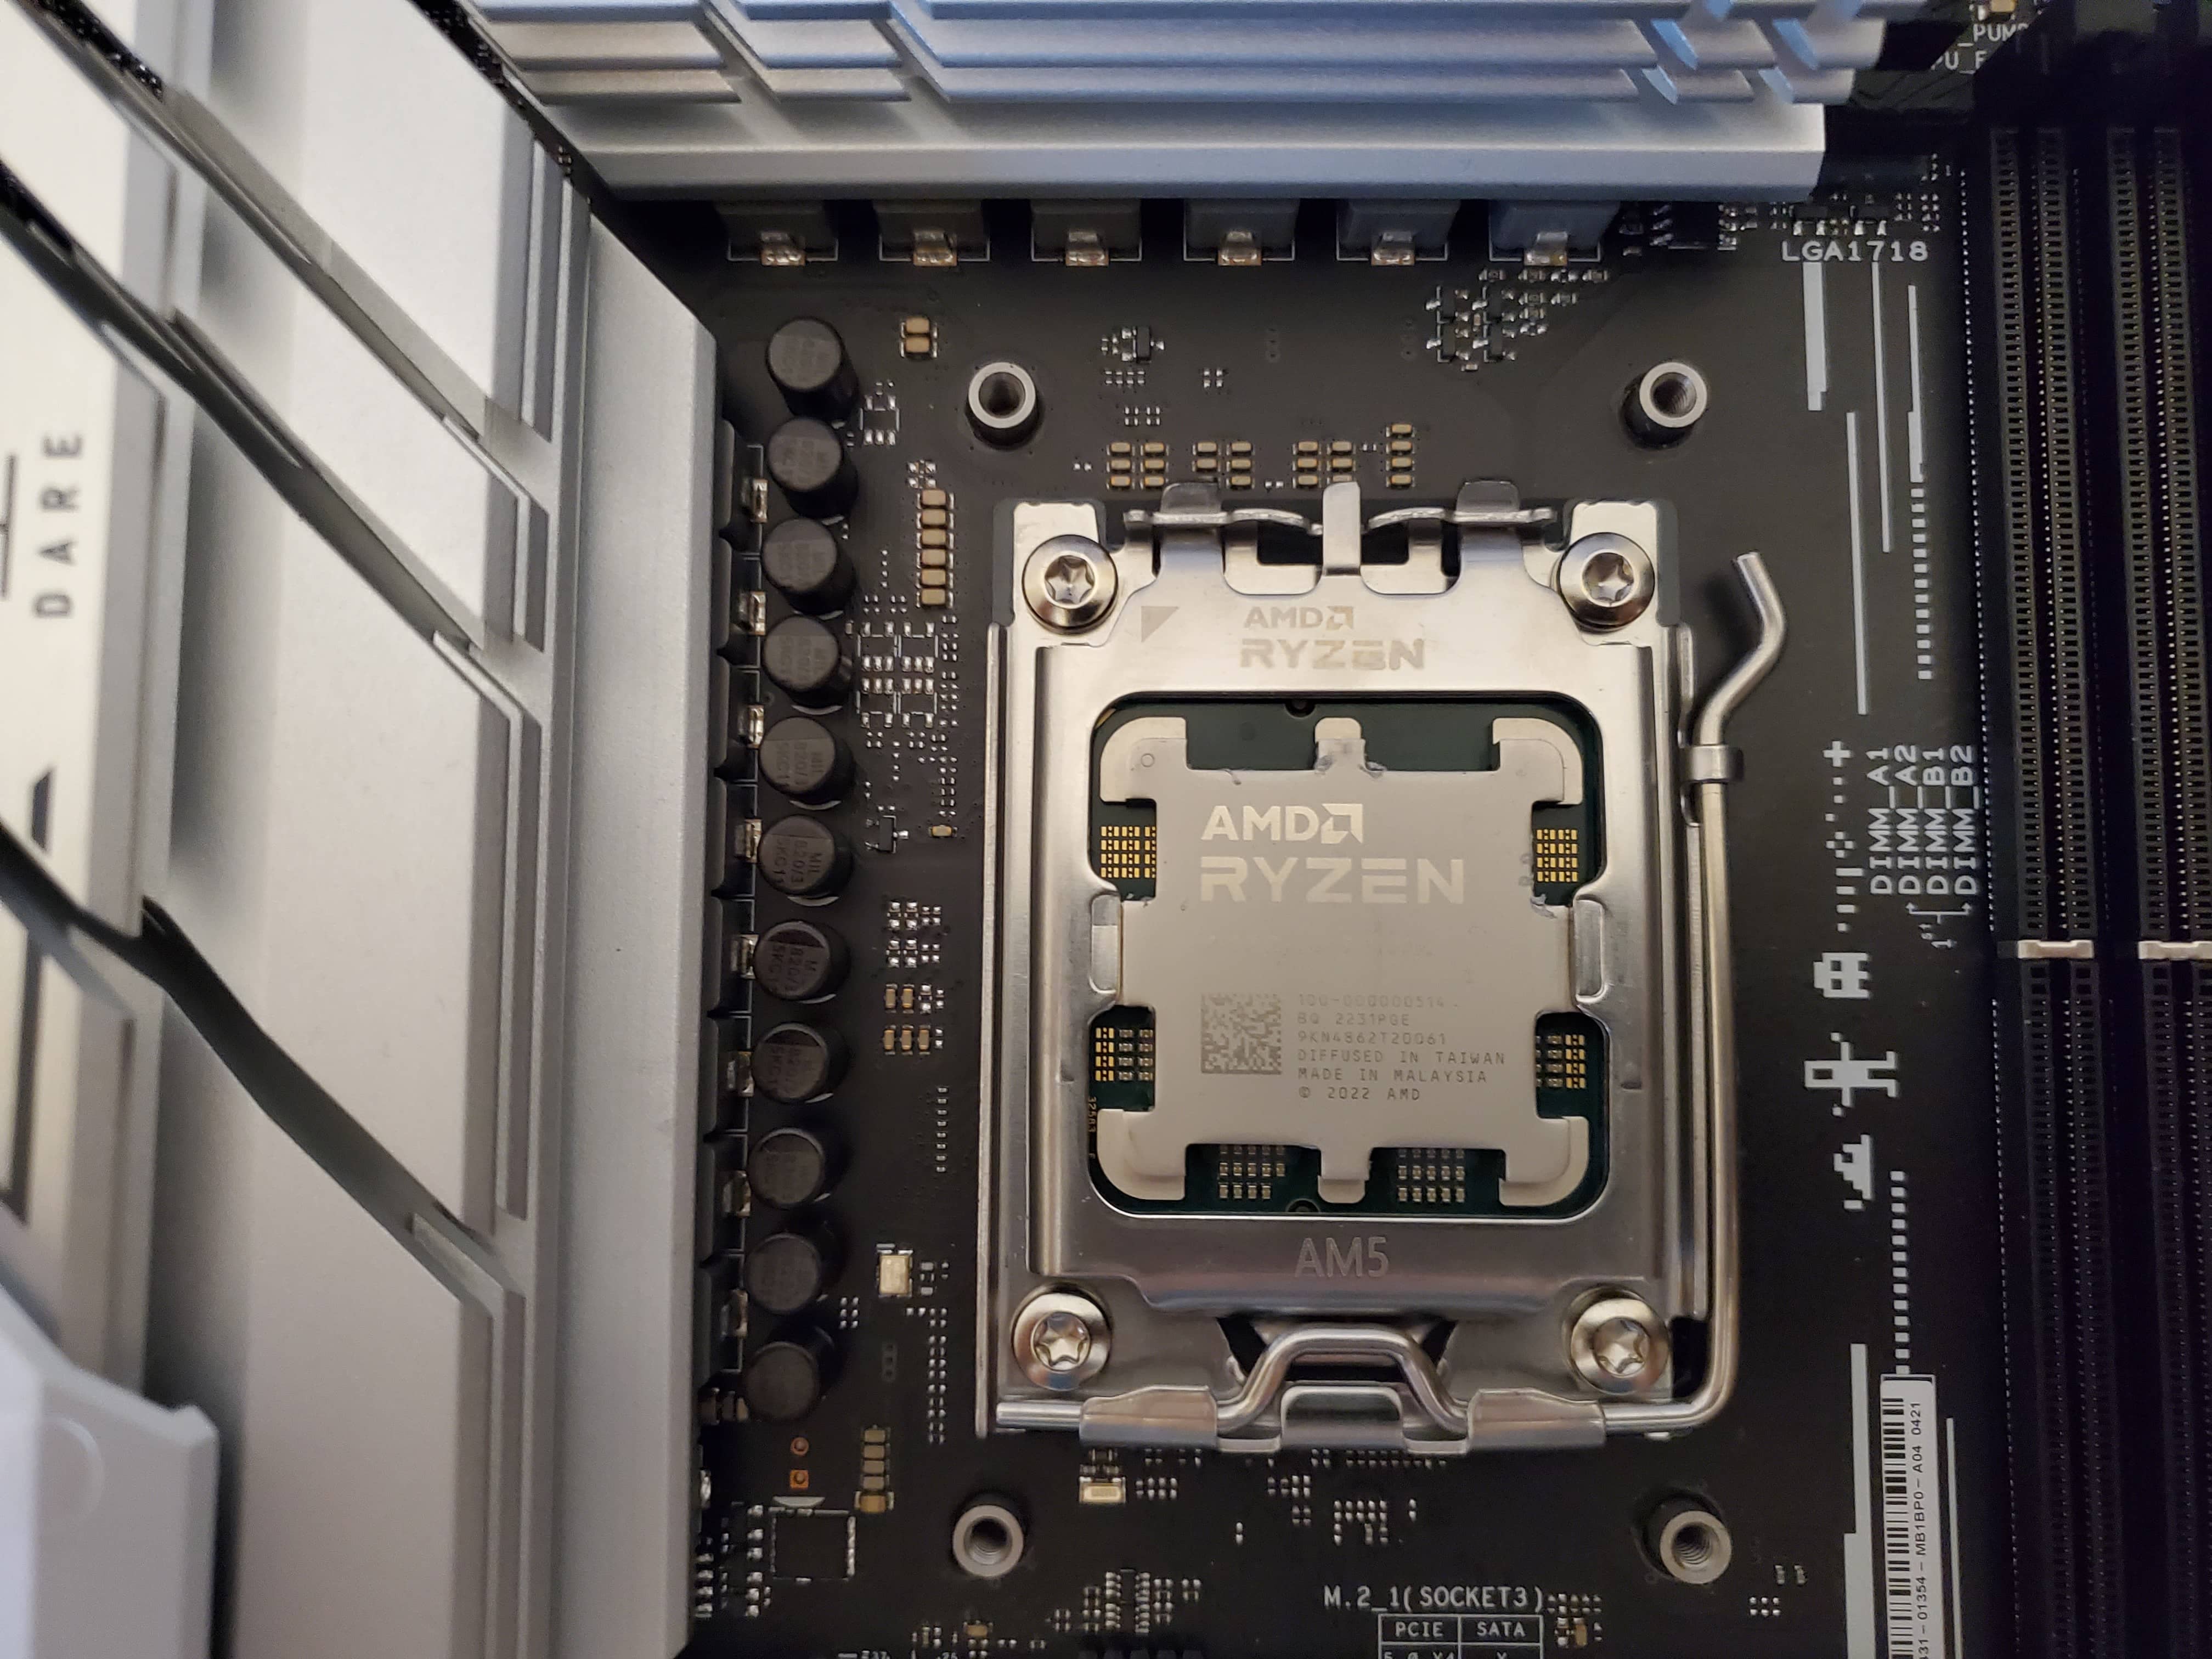
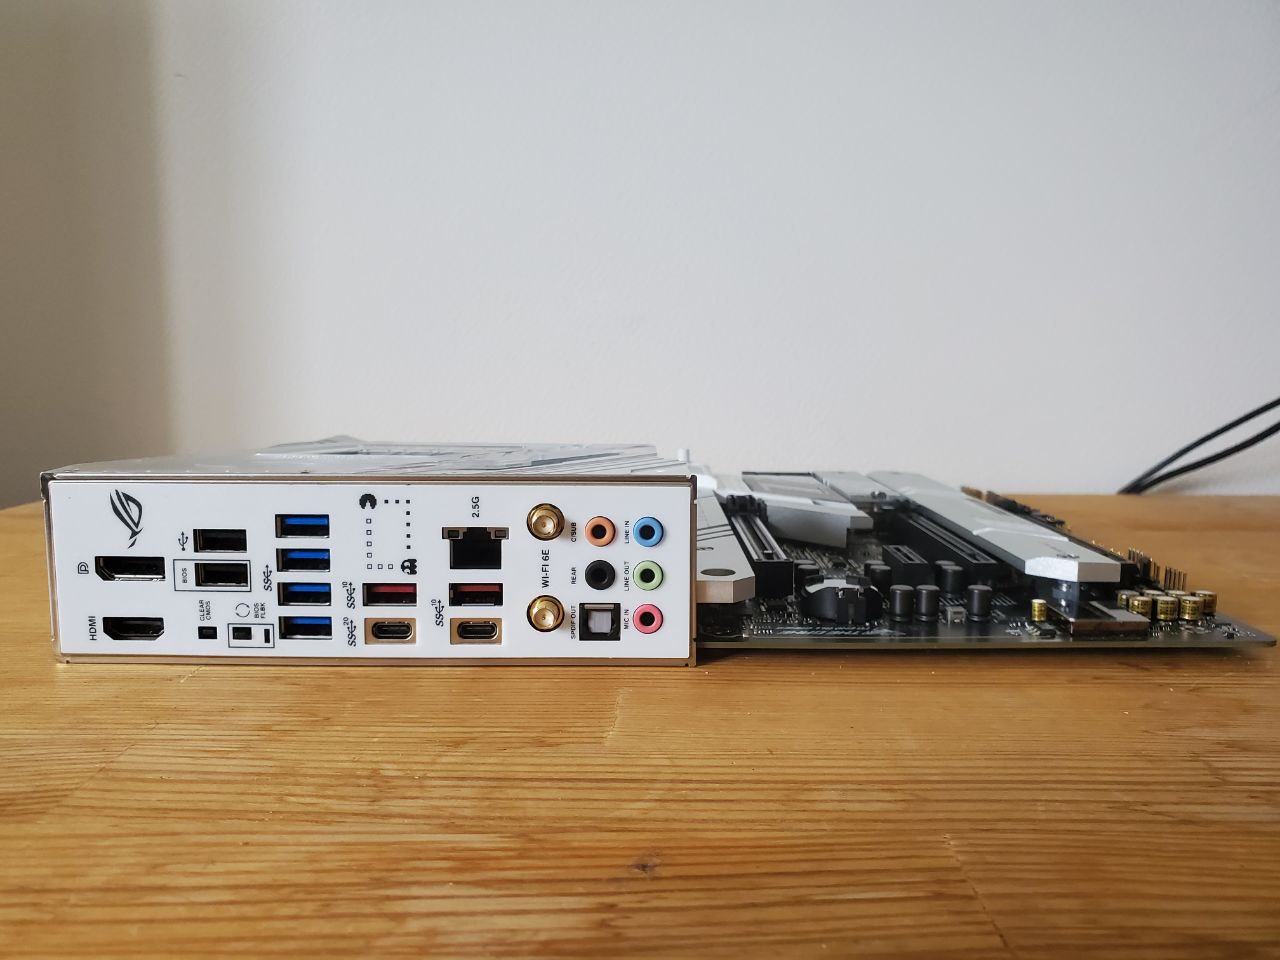
In our review, we present to you the ASUS ROG Strix B650-A Gaming WiFi motherboard . ROG Strix B650-A Gaming WiFi includes 4 DDR5 DIMM modules with a maximum capacity of up to 64 gigabytes and a frequency of up to 6400 MHz. For the file subsystem, the motherboard supports 3 M.2 PCIe 5.0/4.0 x4 slots and 4 SATA 6 Gb/s ports. You can directly view the testing of this motherboard on our website.
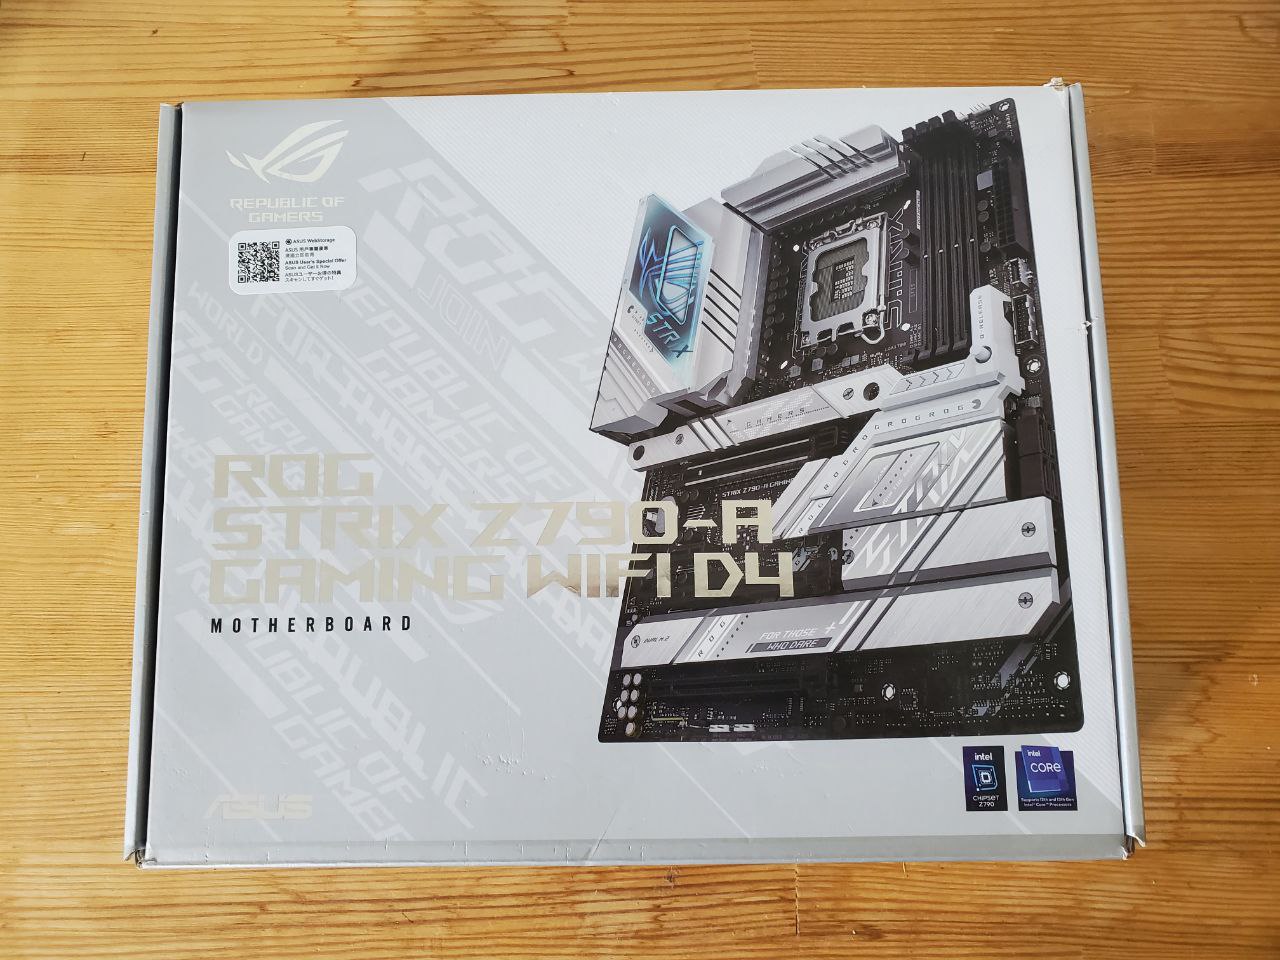
In our review, we present you ASUS Z790-A GAMING DDR4 motherboards . We use this motherboard as a test bench for testing new generations of Intel processors .
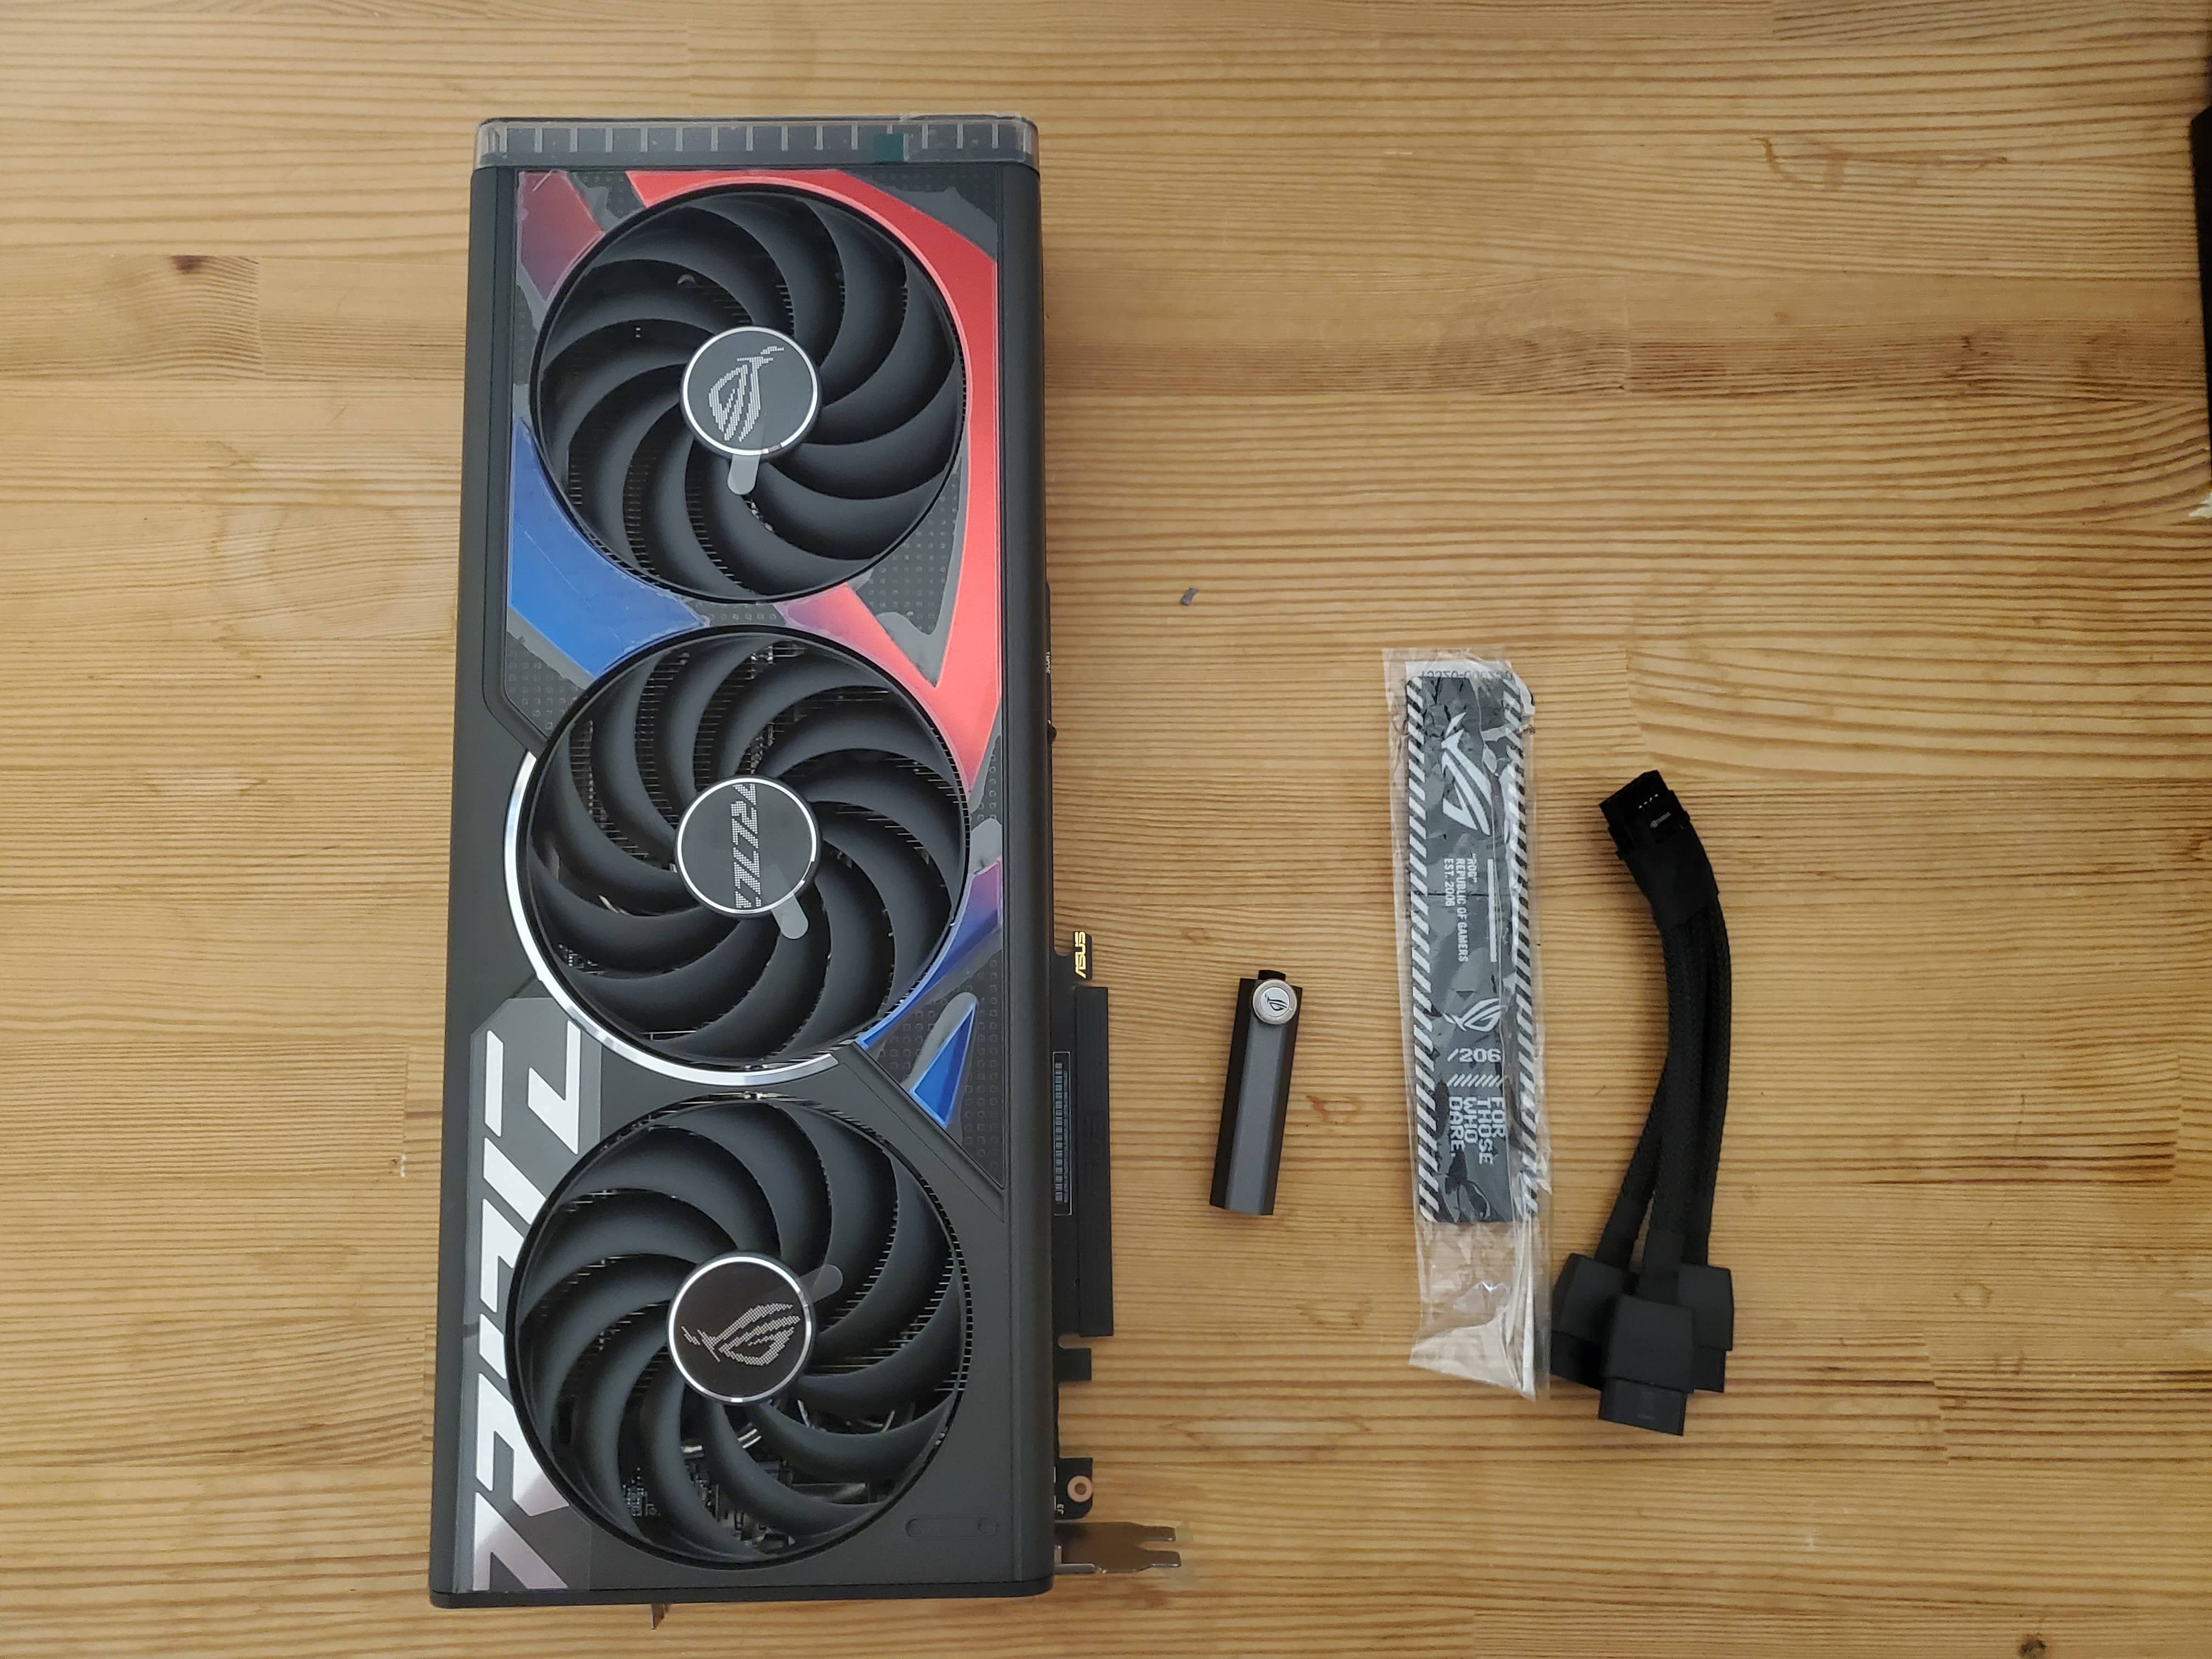
This time our test involves the top video card from ASUS ROG Strix GeForce RTX 4070 Ti OC . The GeForce RTX 4070 Ti is based on the AD104 GPU and features 7680 CUDA cores and 12GB of GDDR6X memory. Test this video card on our website.
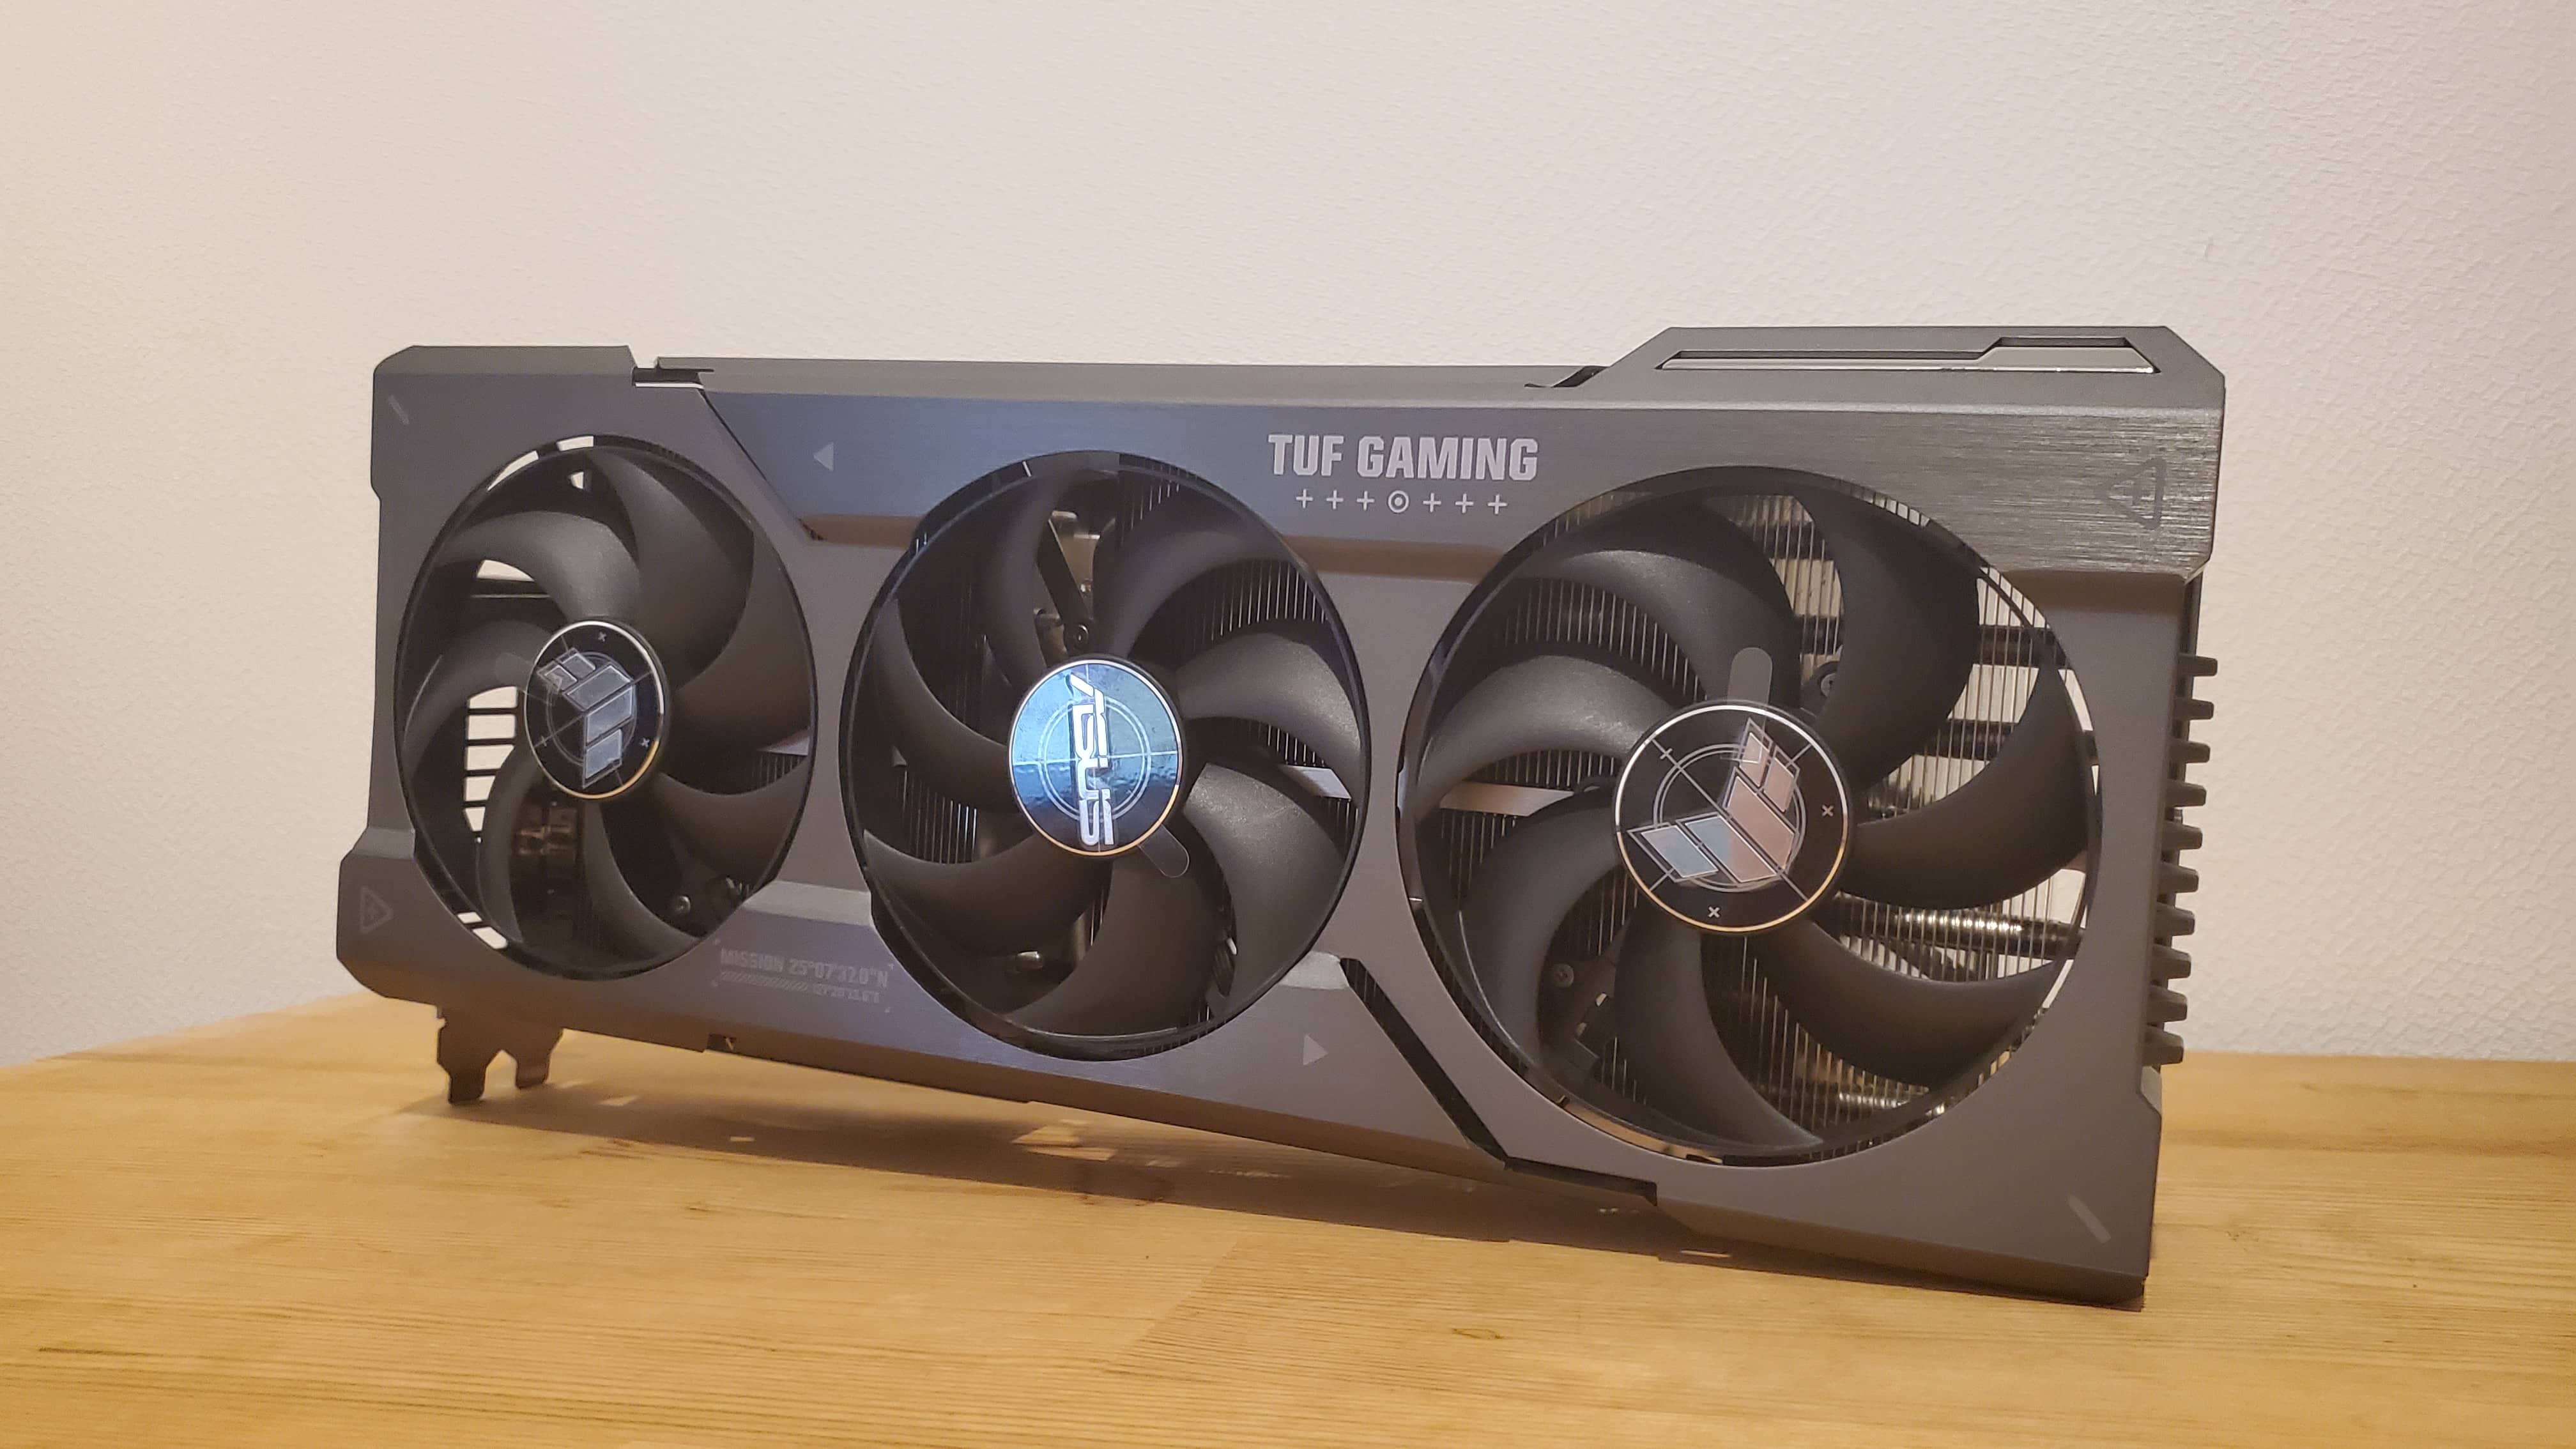
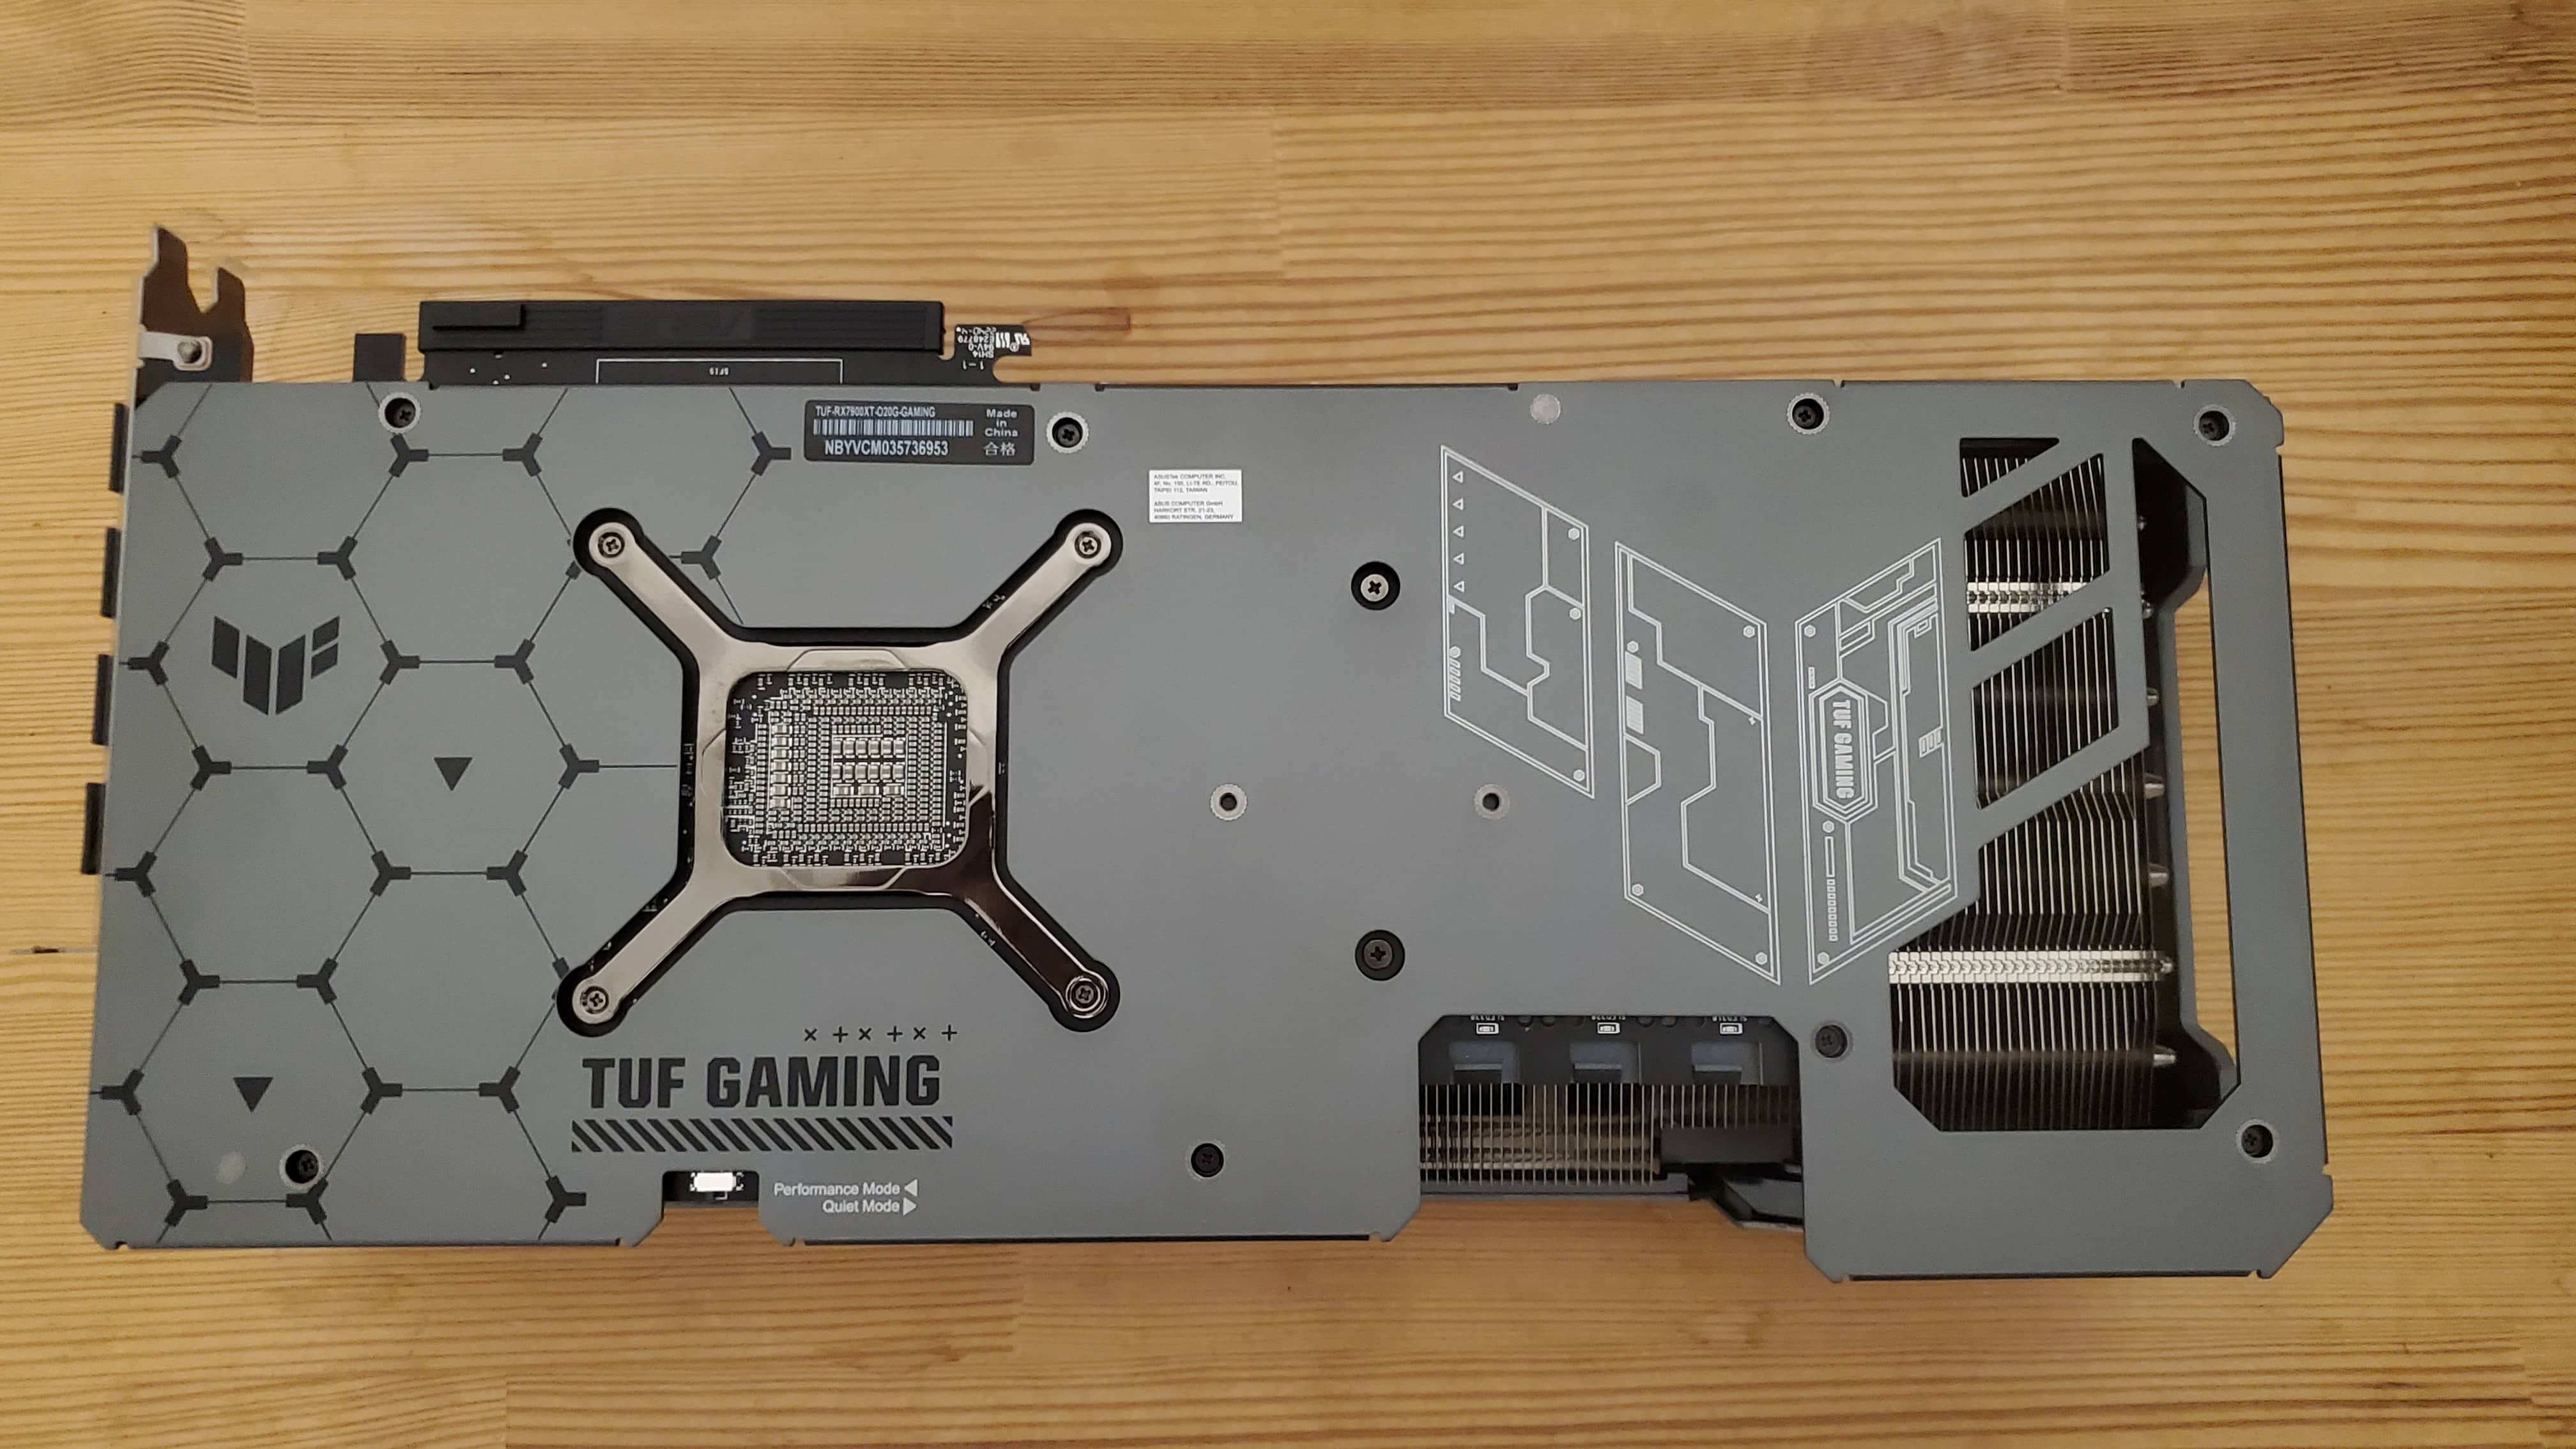
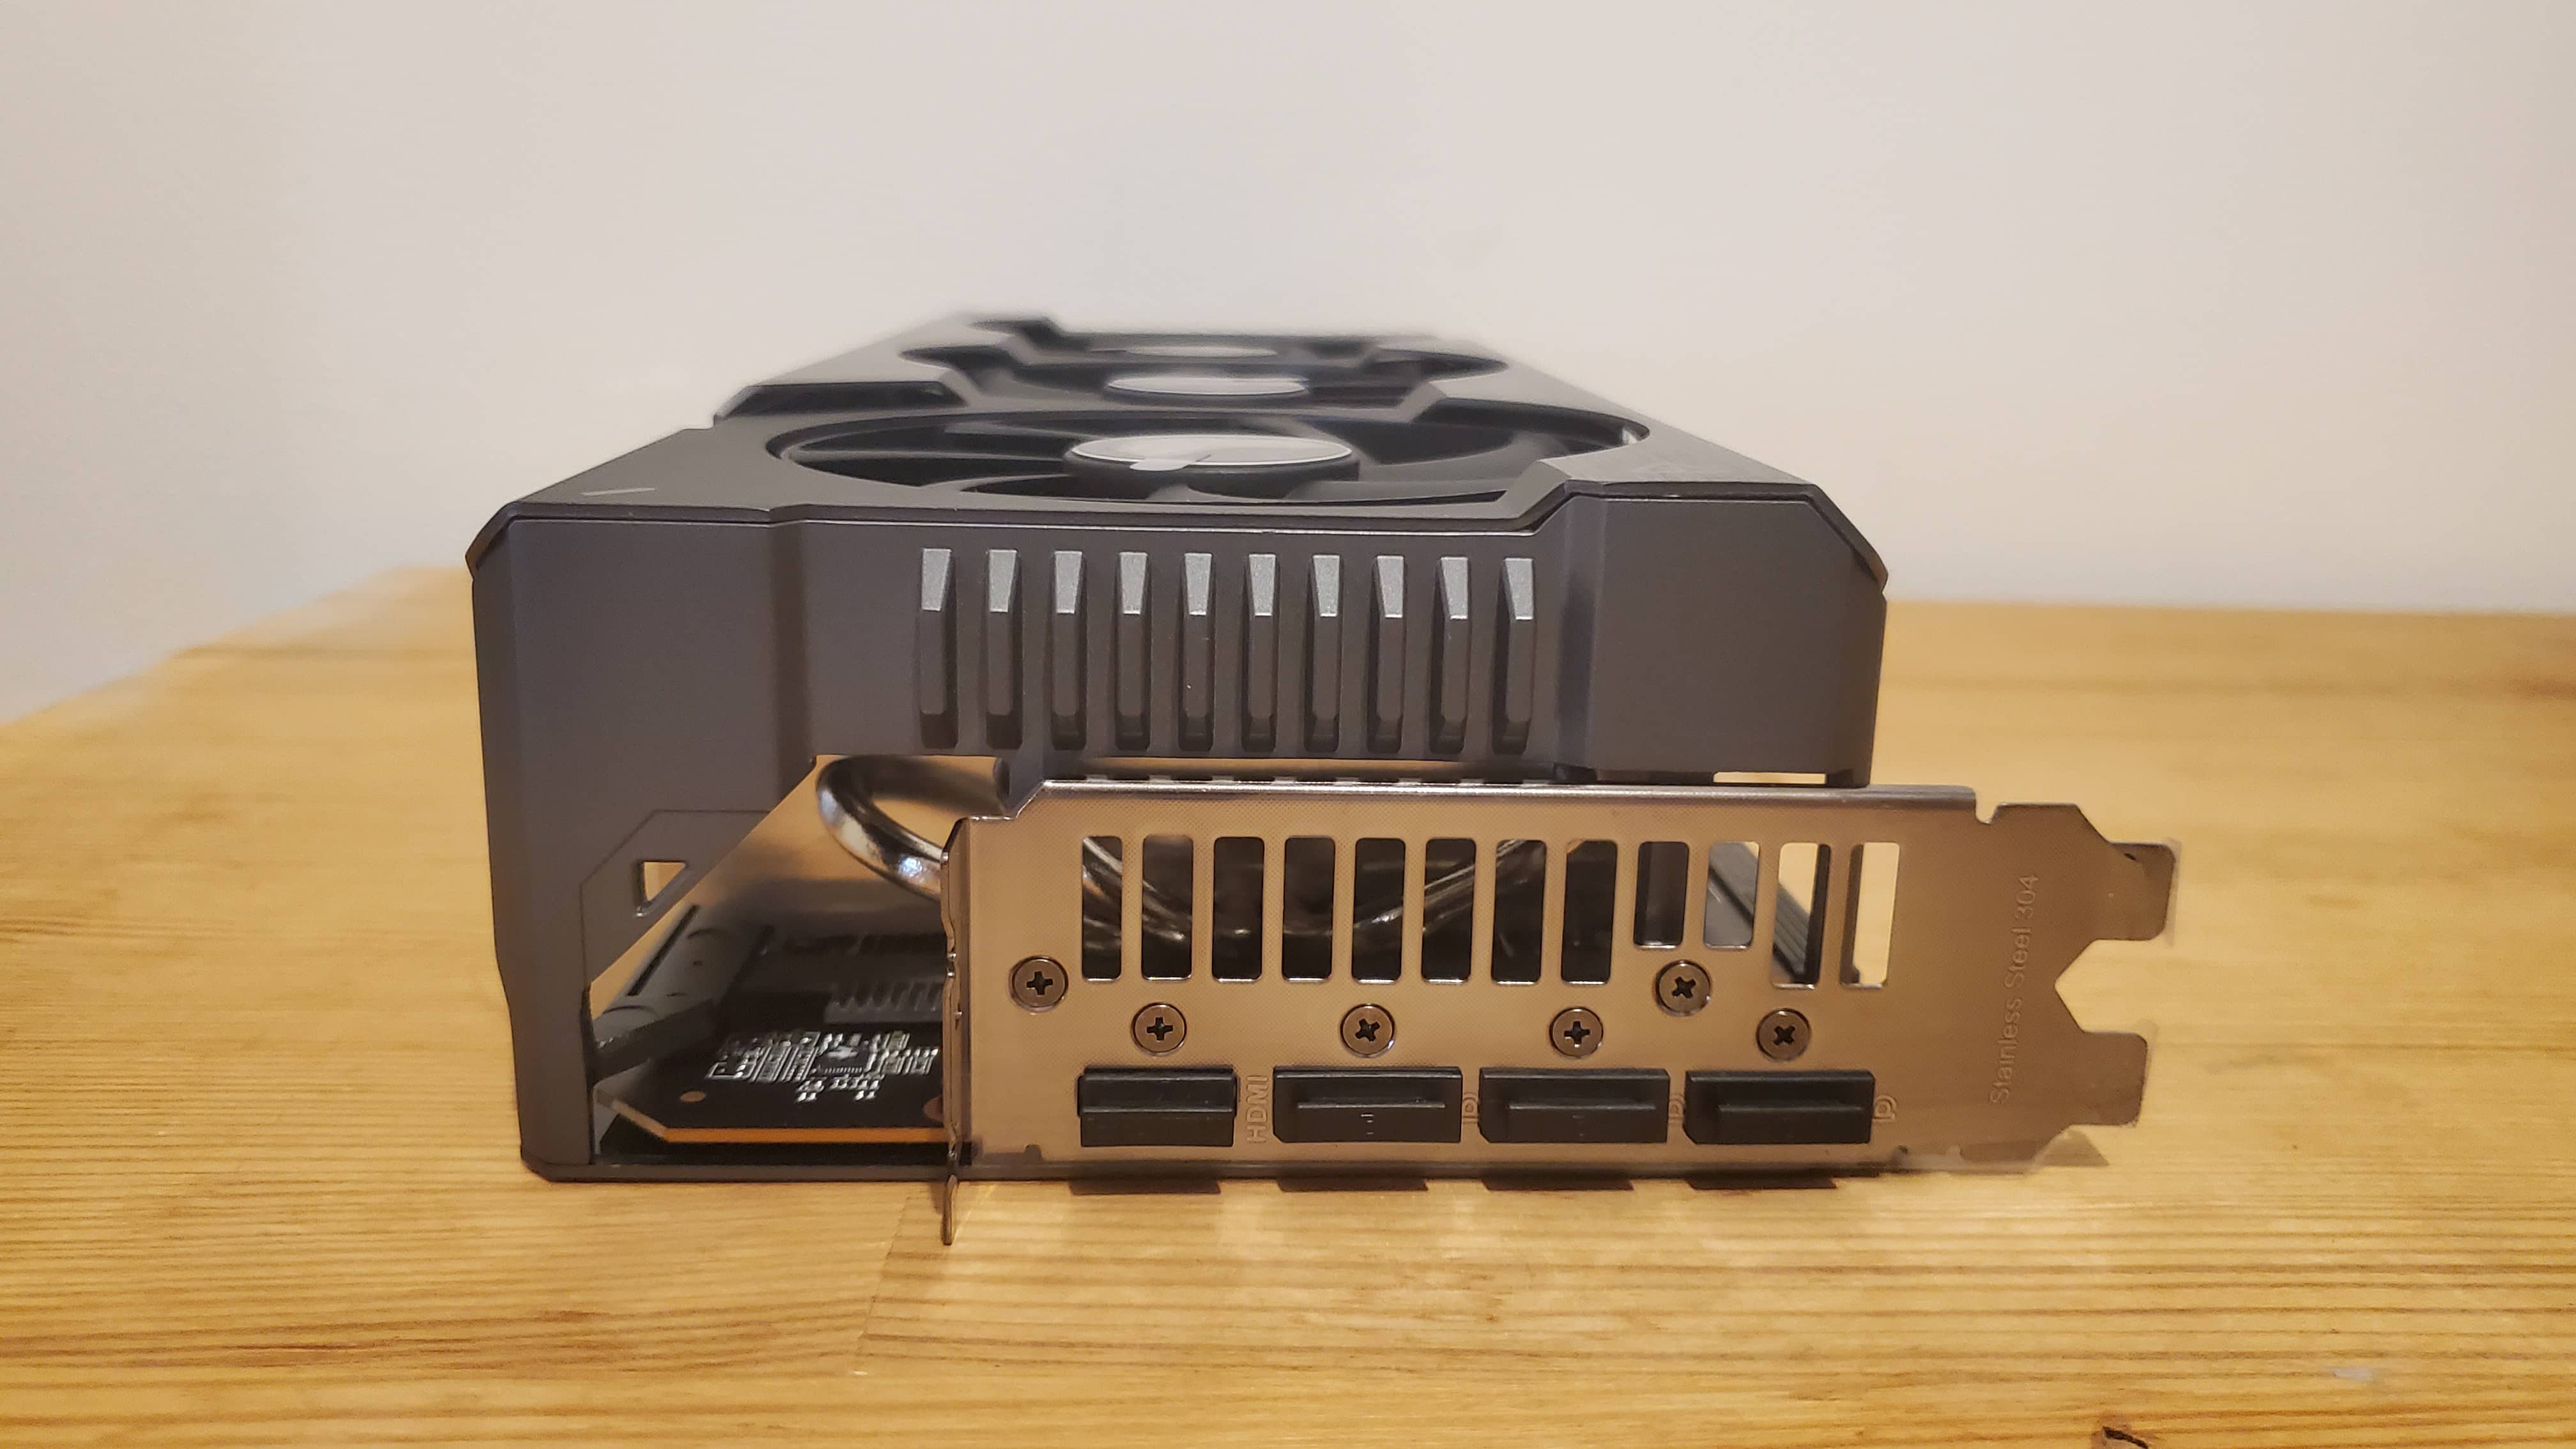
This time our test involves the company's top-end video card ASUS TUF Gaming Radeon RX 7900 XT OC Edition 20 GB . . This video card is based on the RDNA 3 architecture, operates at a frequency of 2500 MHz and has 20 gigabytes of video memory.
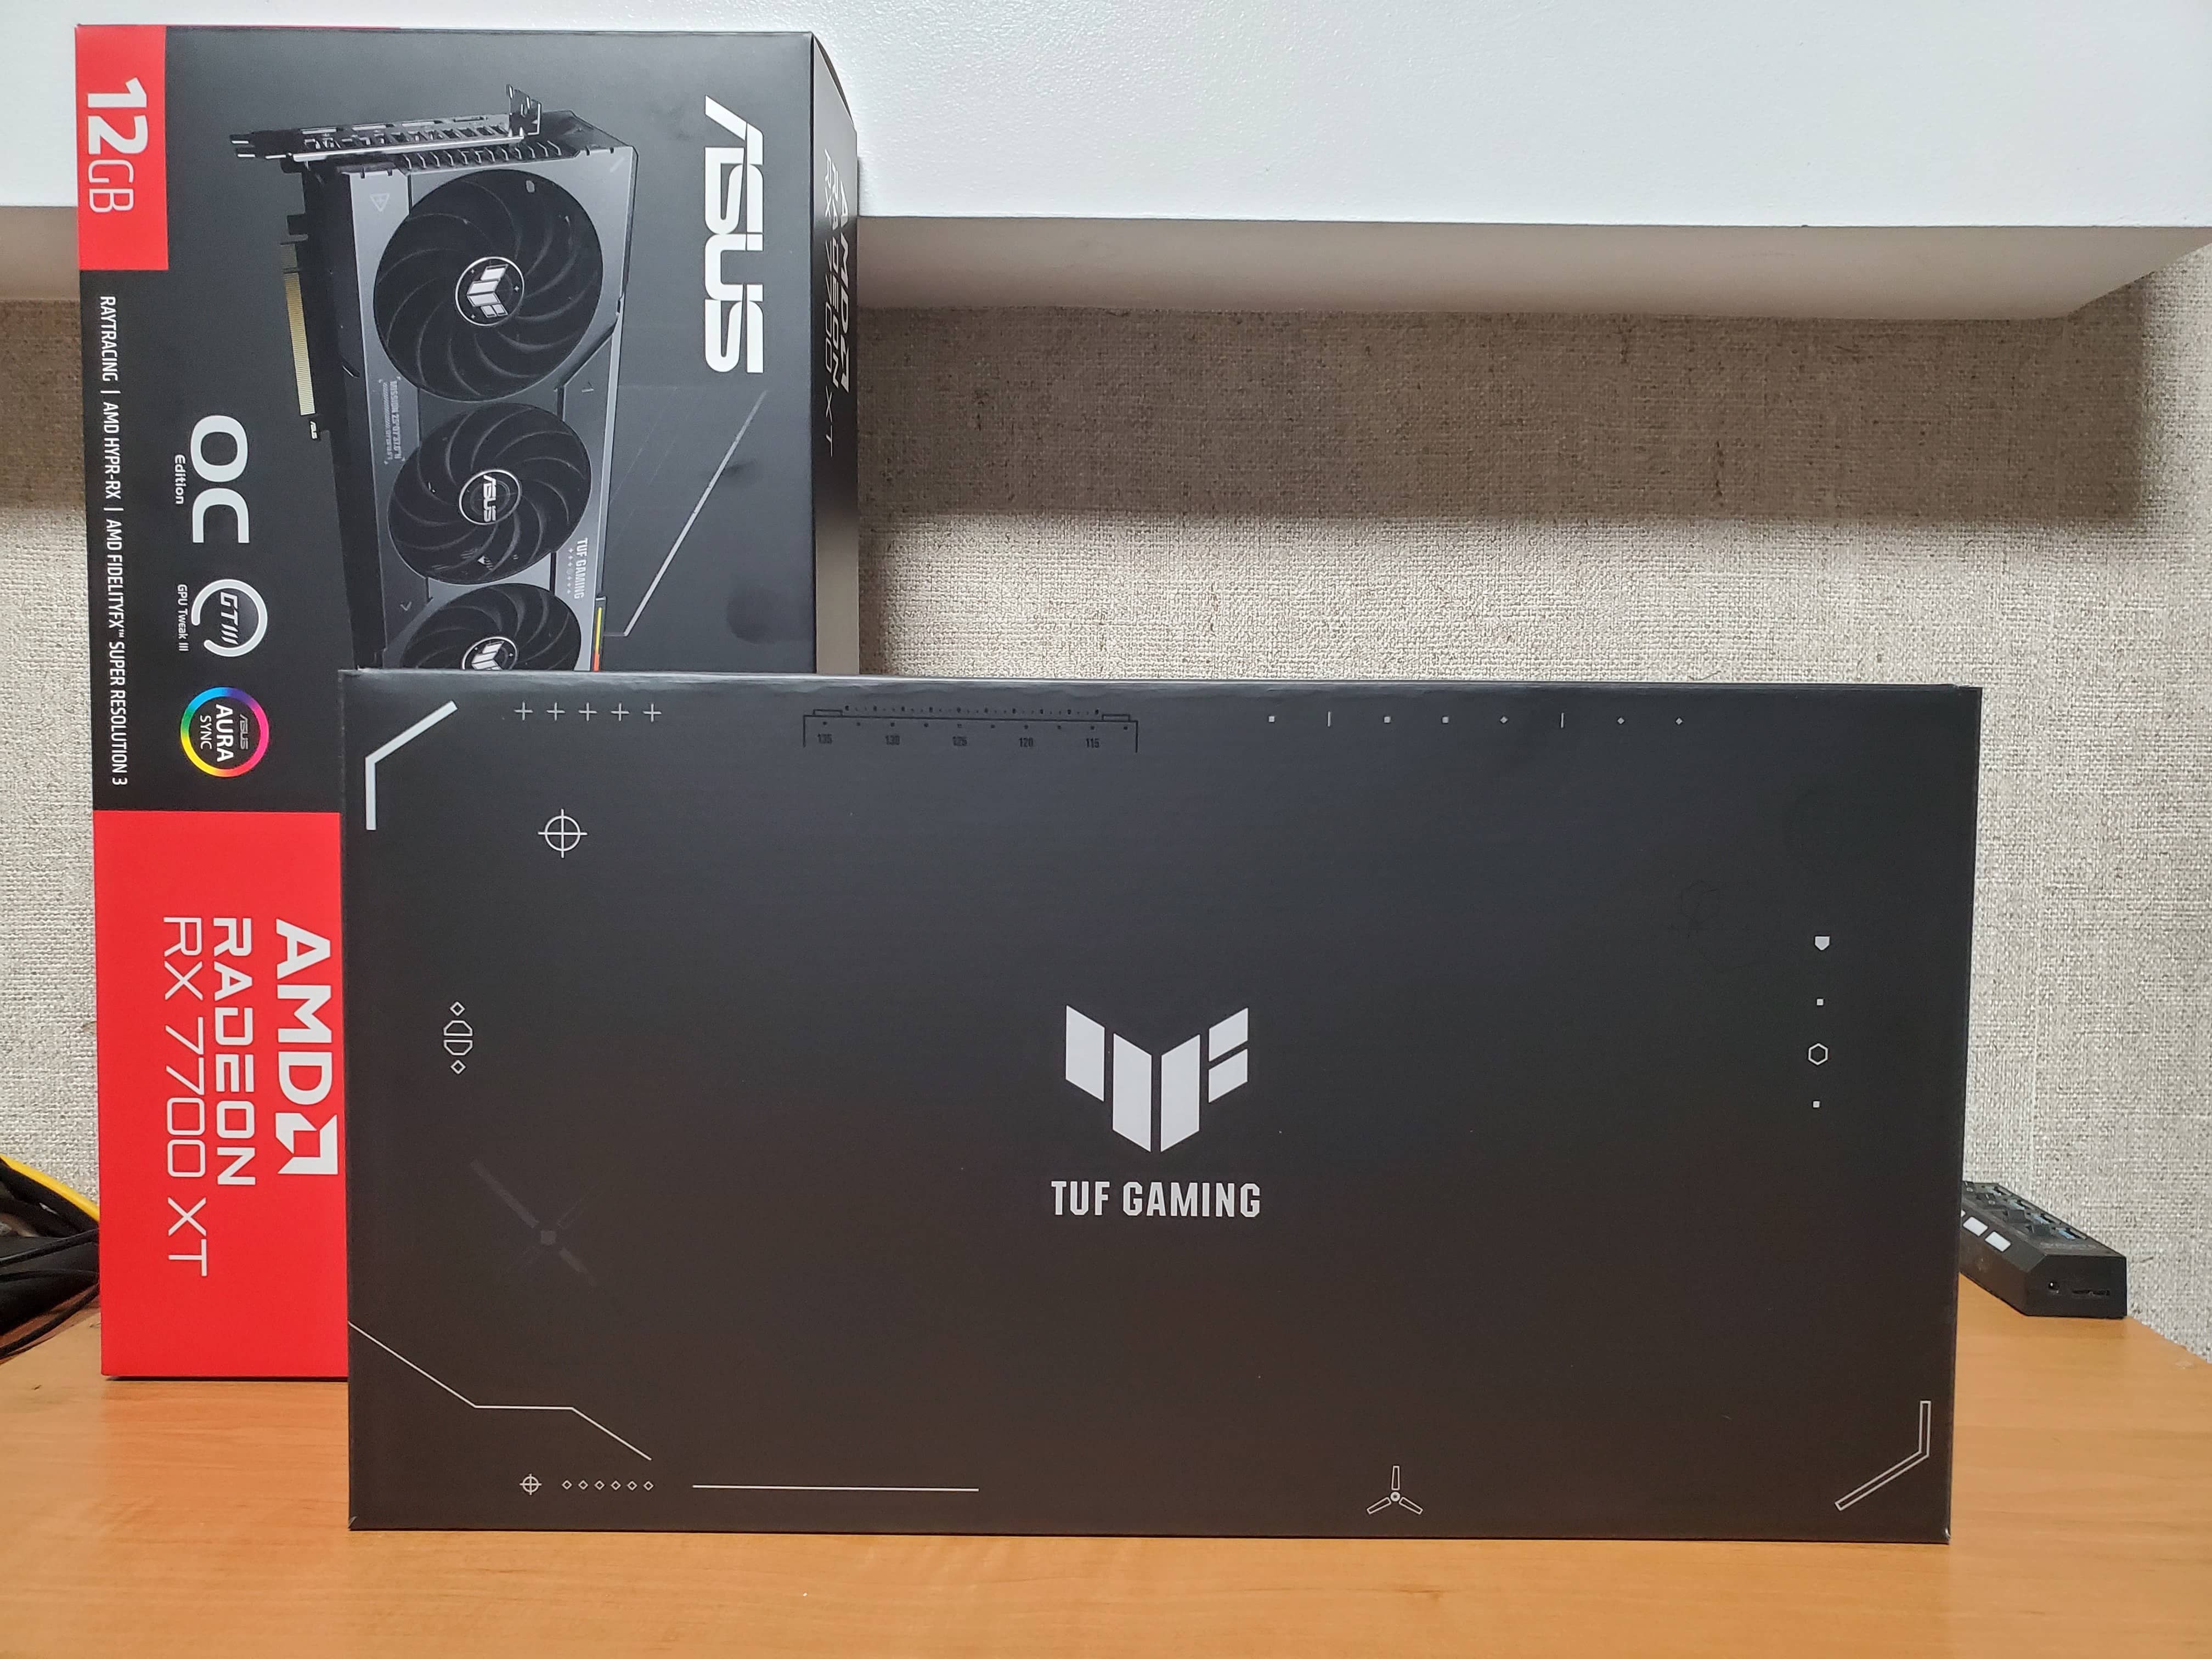
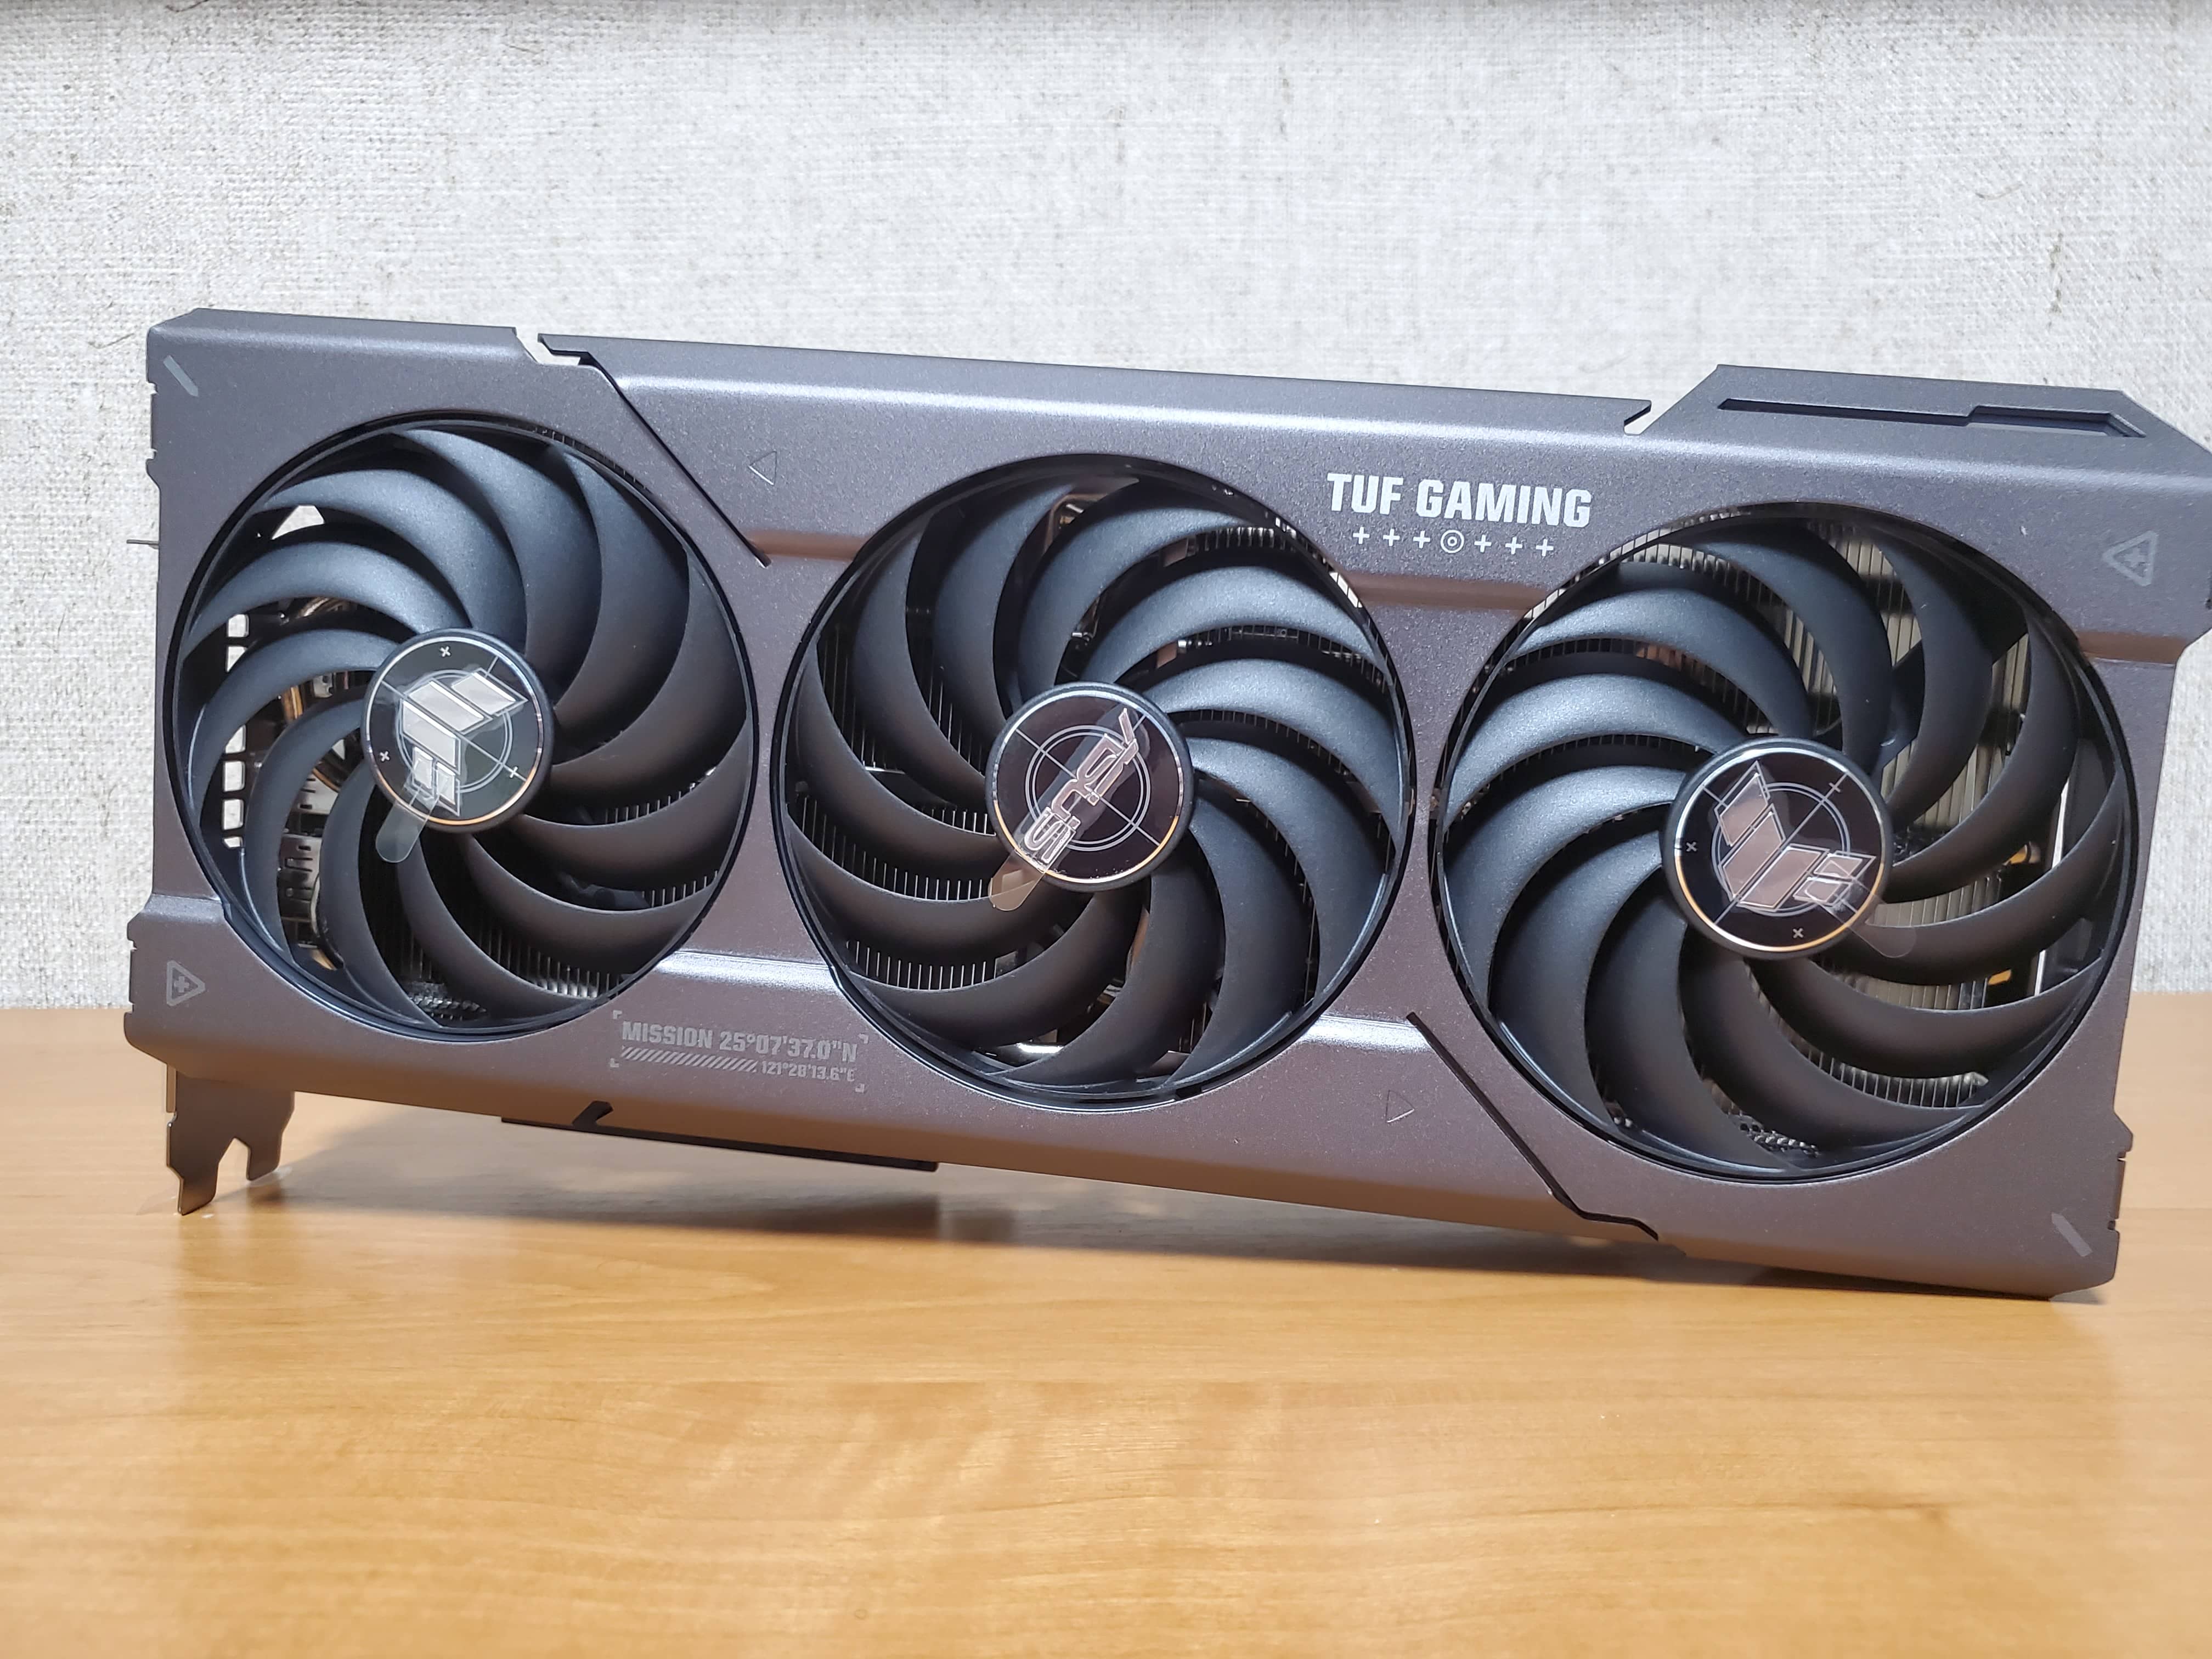
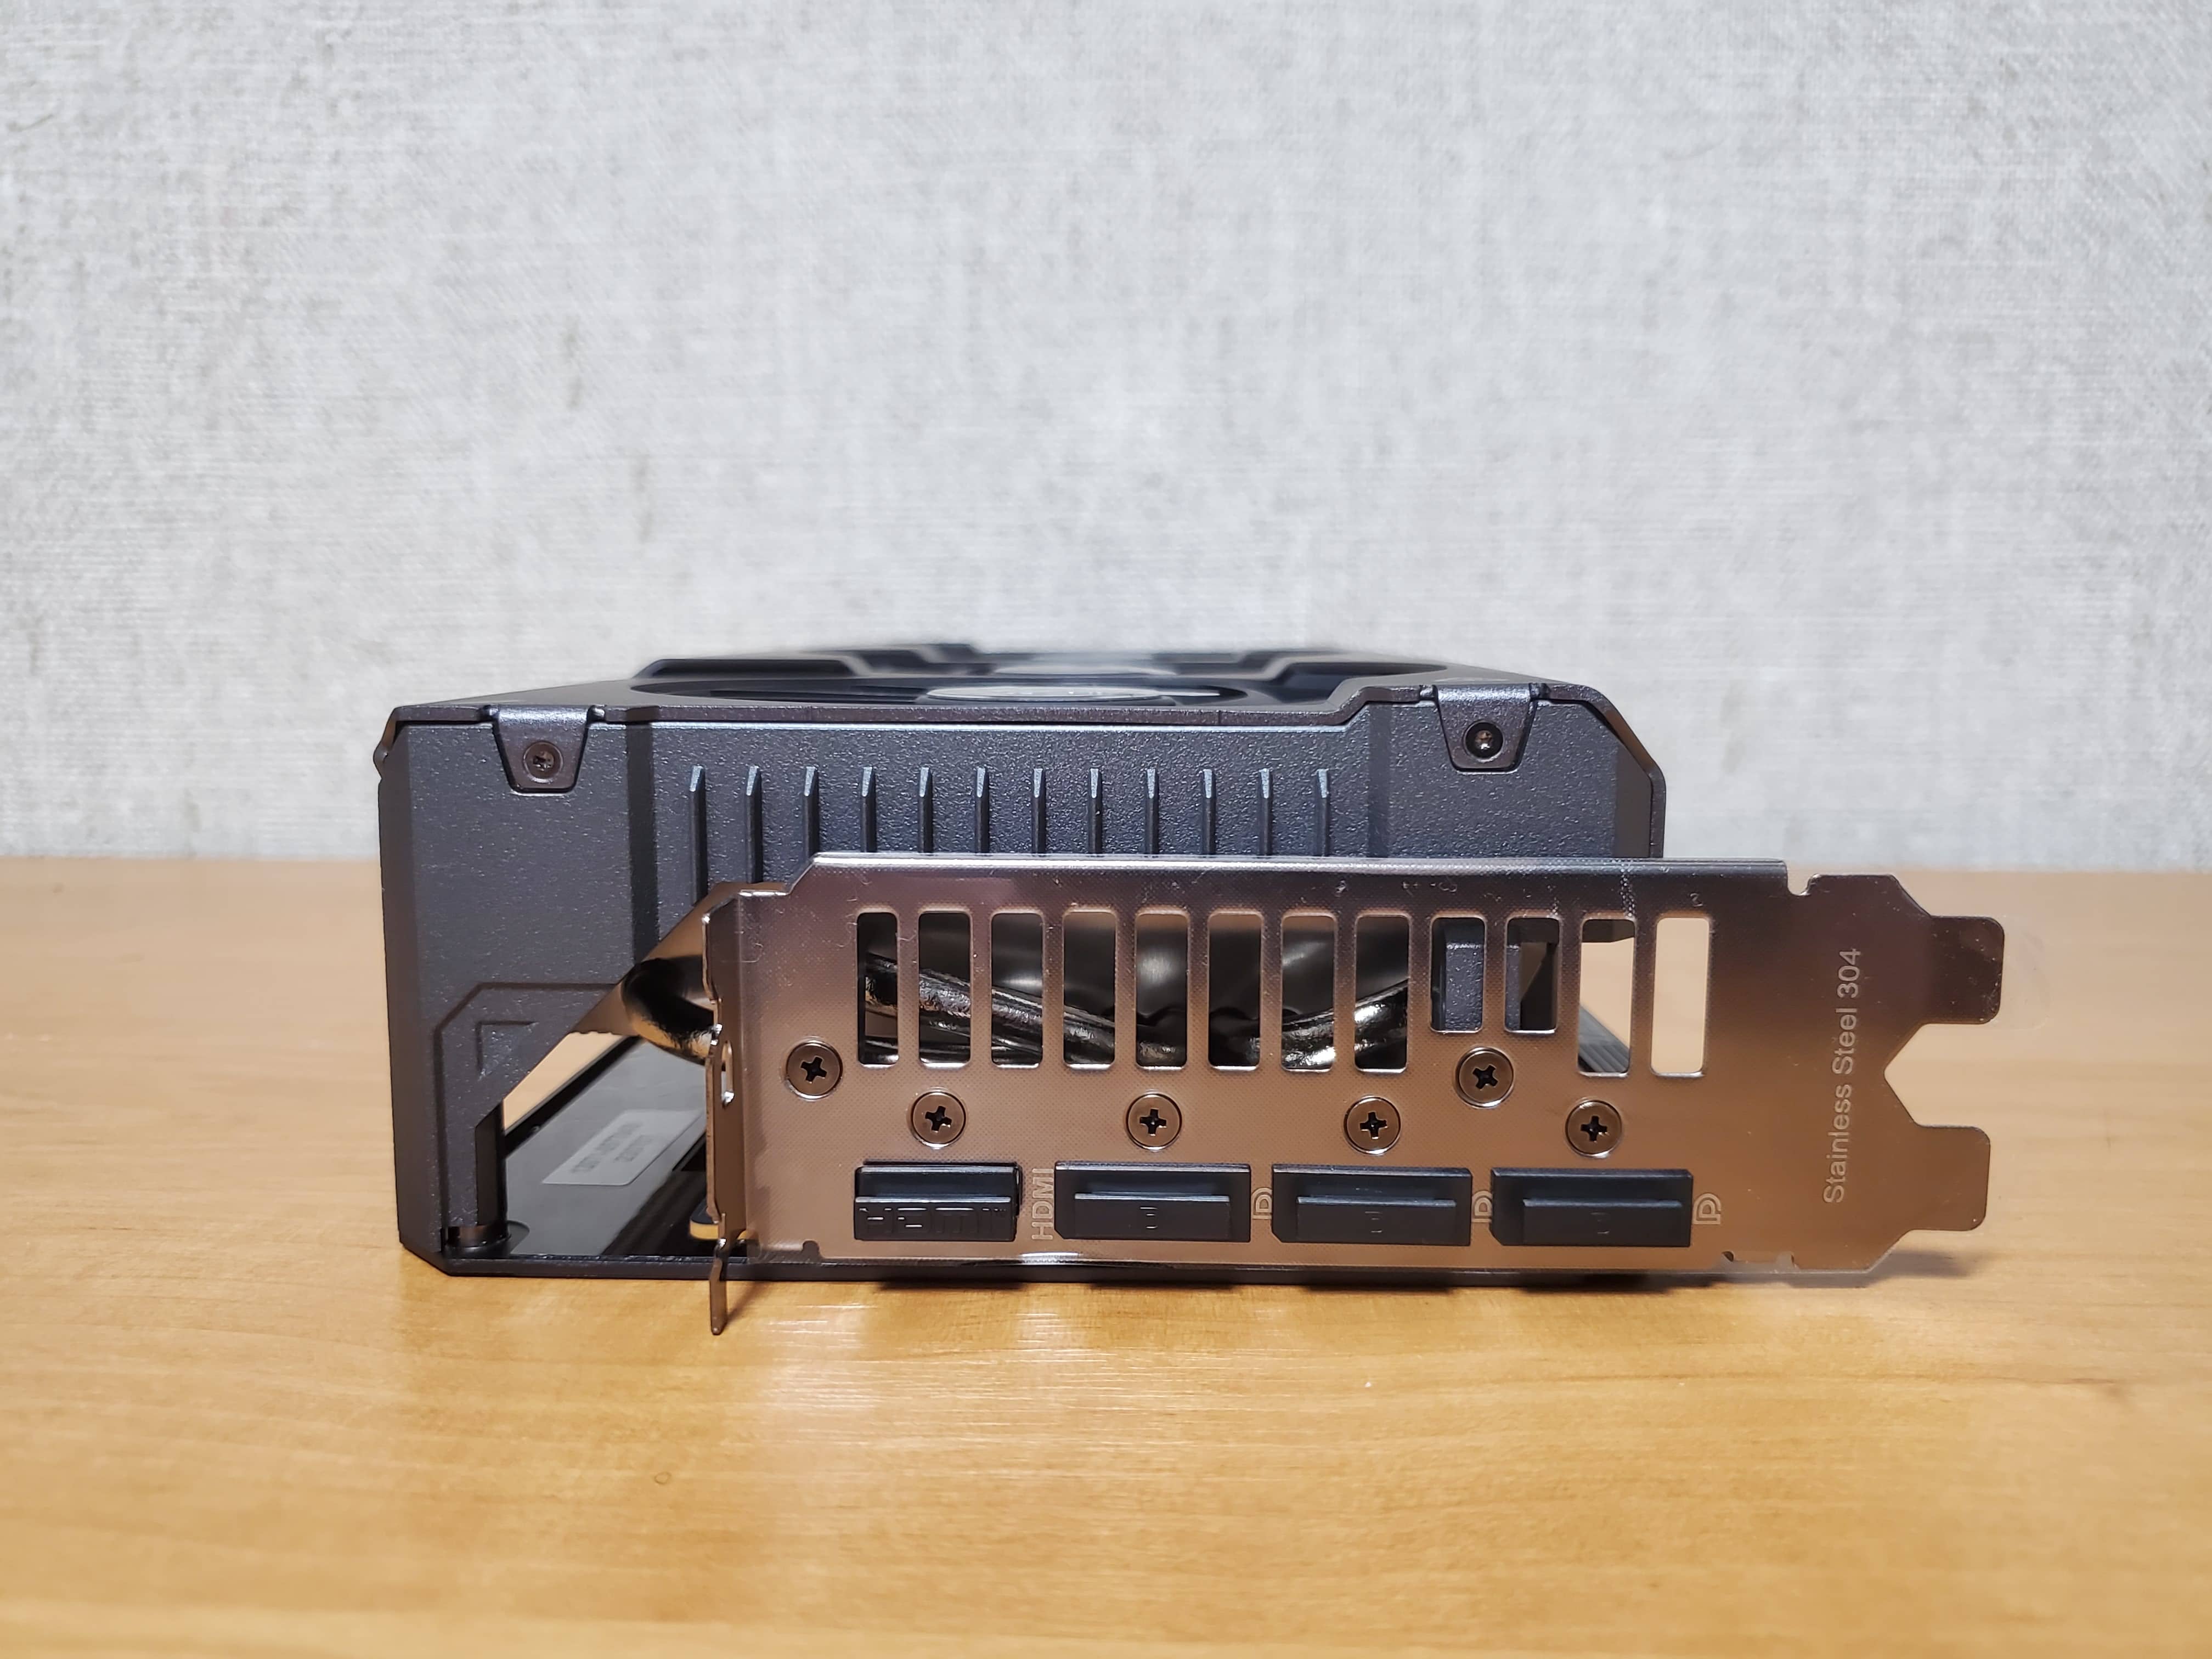
This time our test involves the company's top-end video card ASUS TUF Gaming Radeon RX 7700 XT OC Edition 12 GB . . This video card is based on the RDNA 3 architecture, operates at a frequency of 2600 MHz and has 12 gigabytes of video memory.
| NEW PRODUCTS PROVIDED FOR TESTS BY DEEPCOOL |
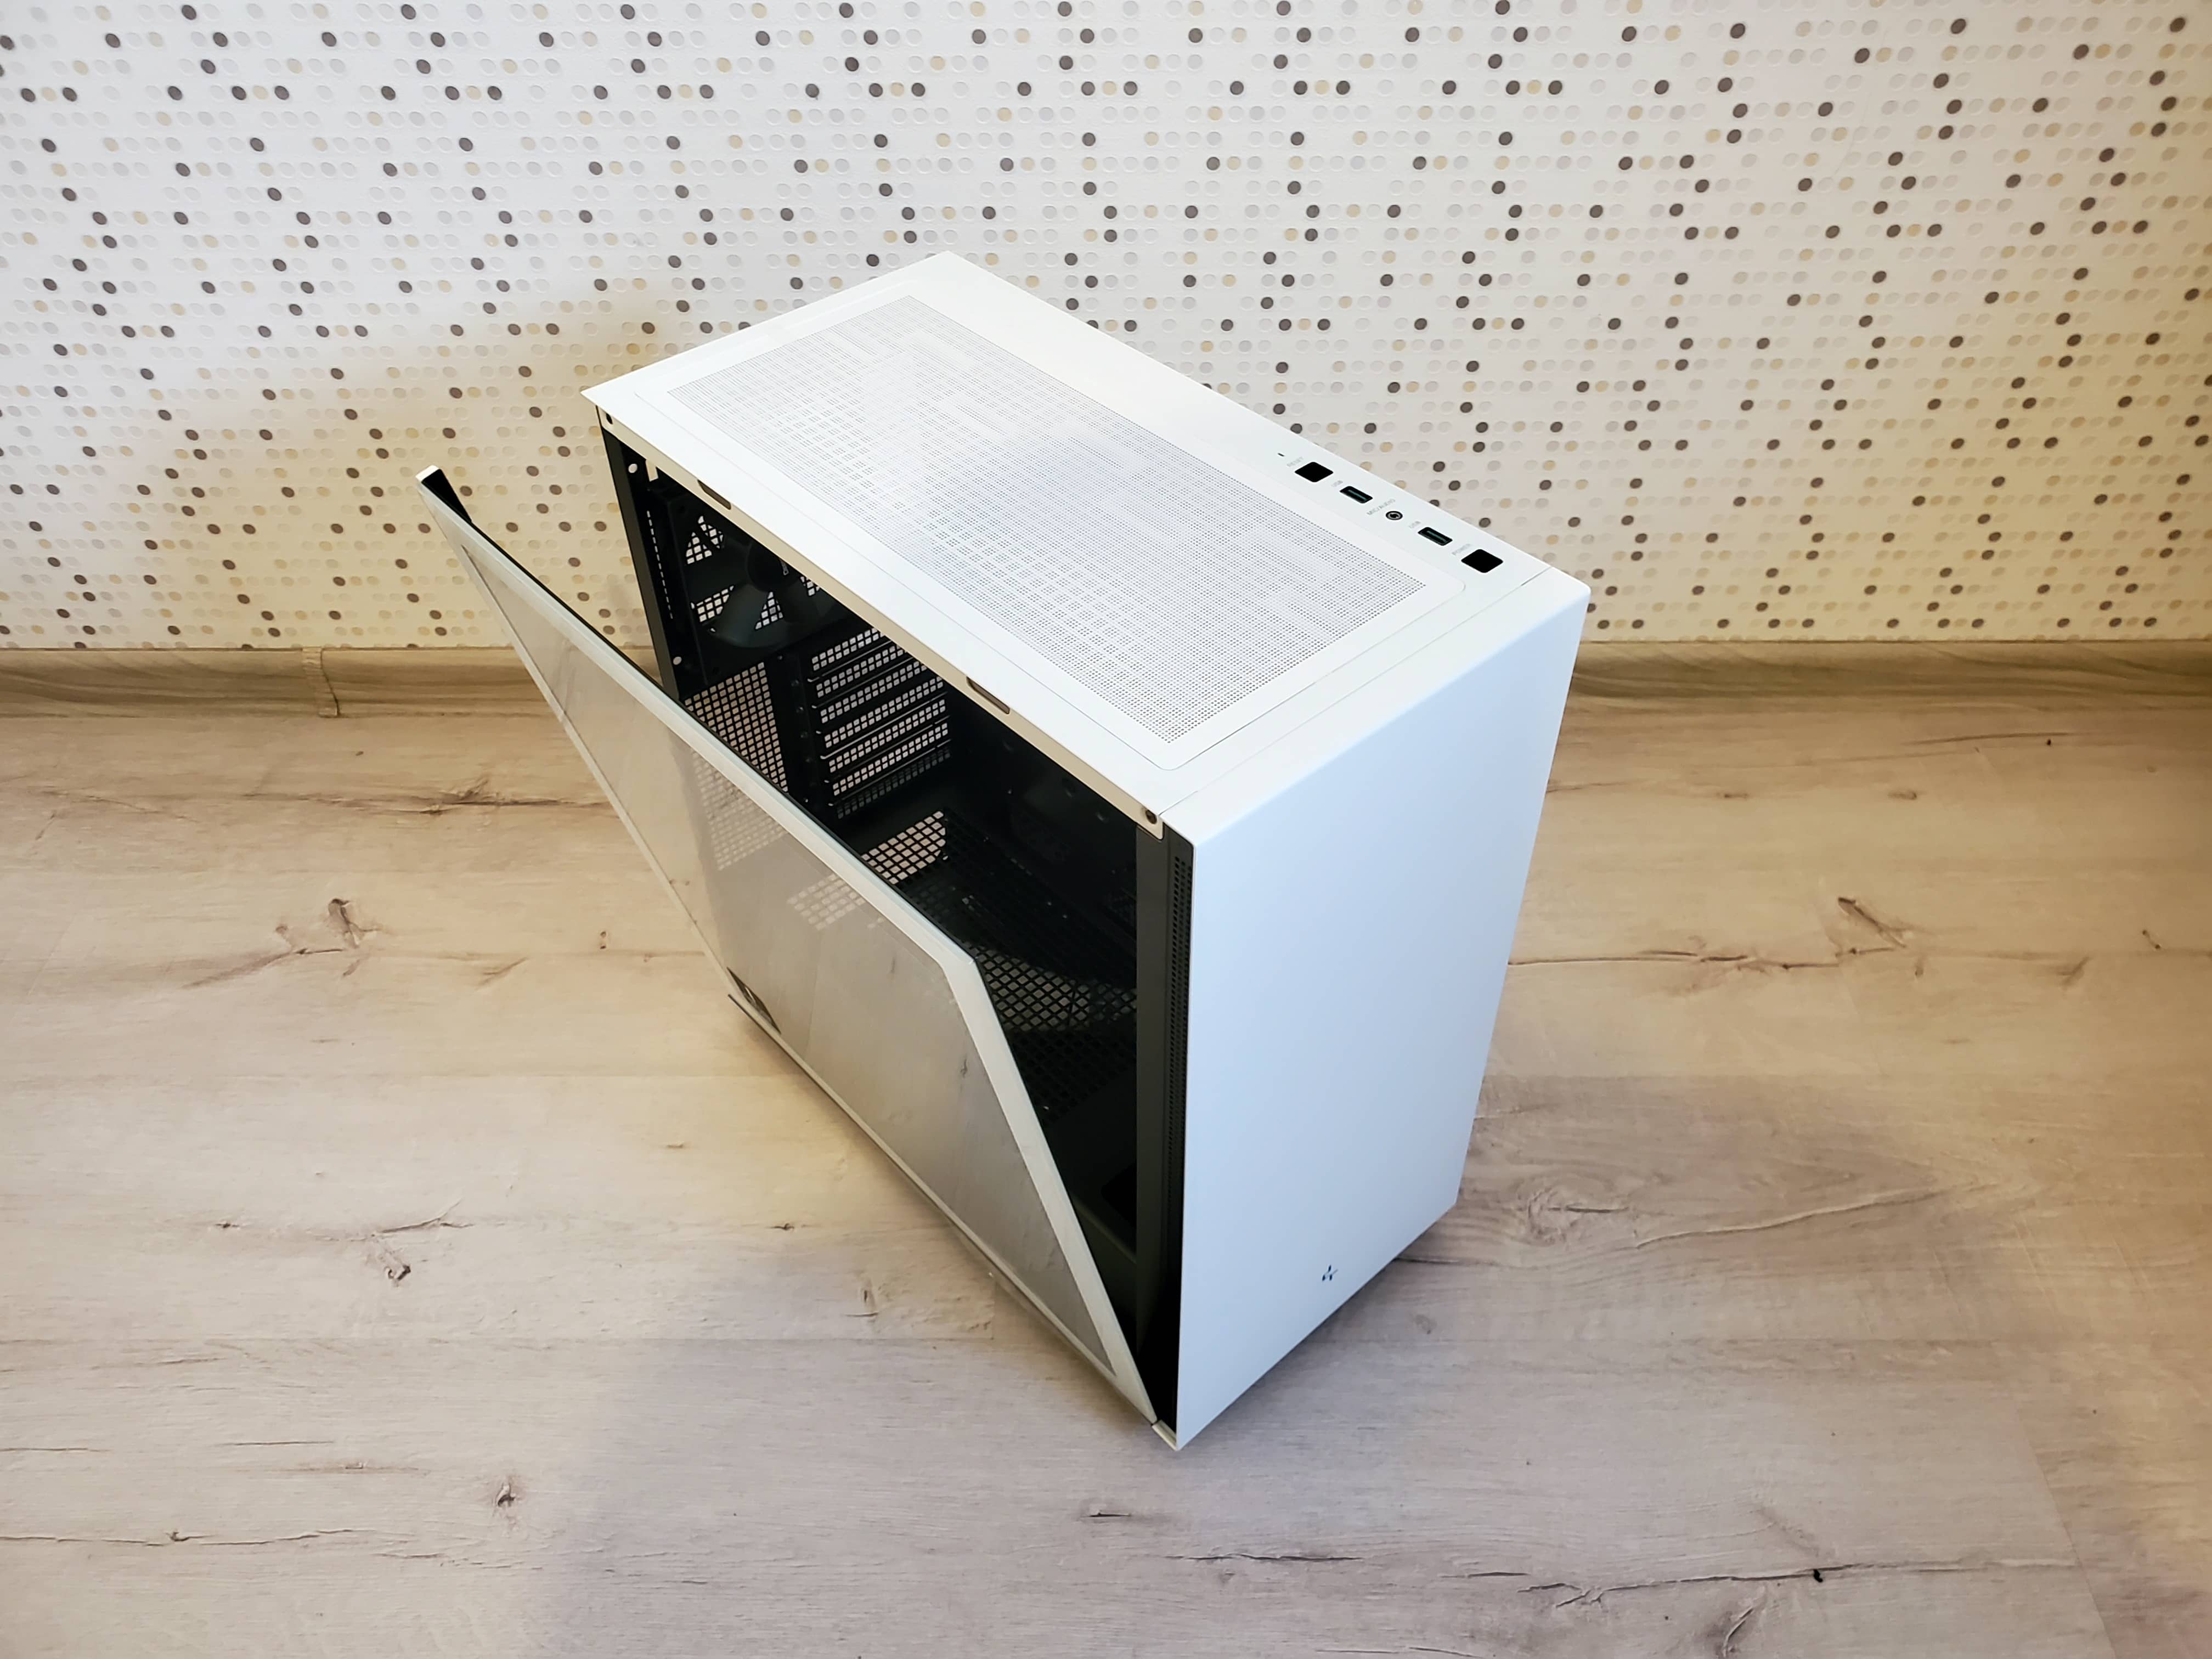
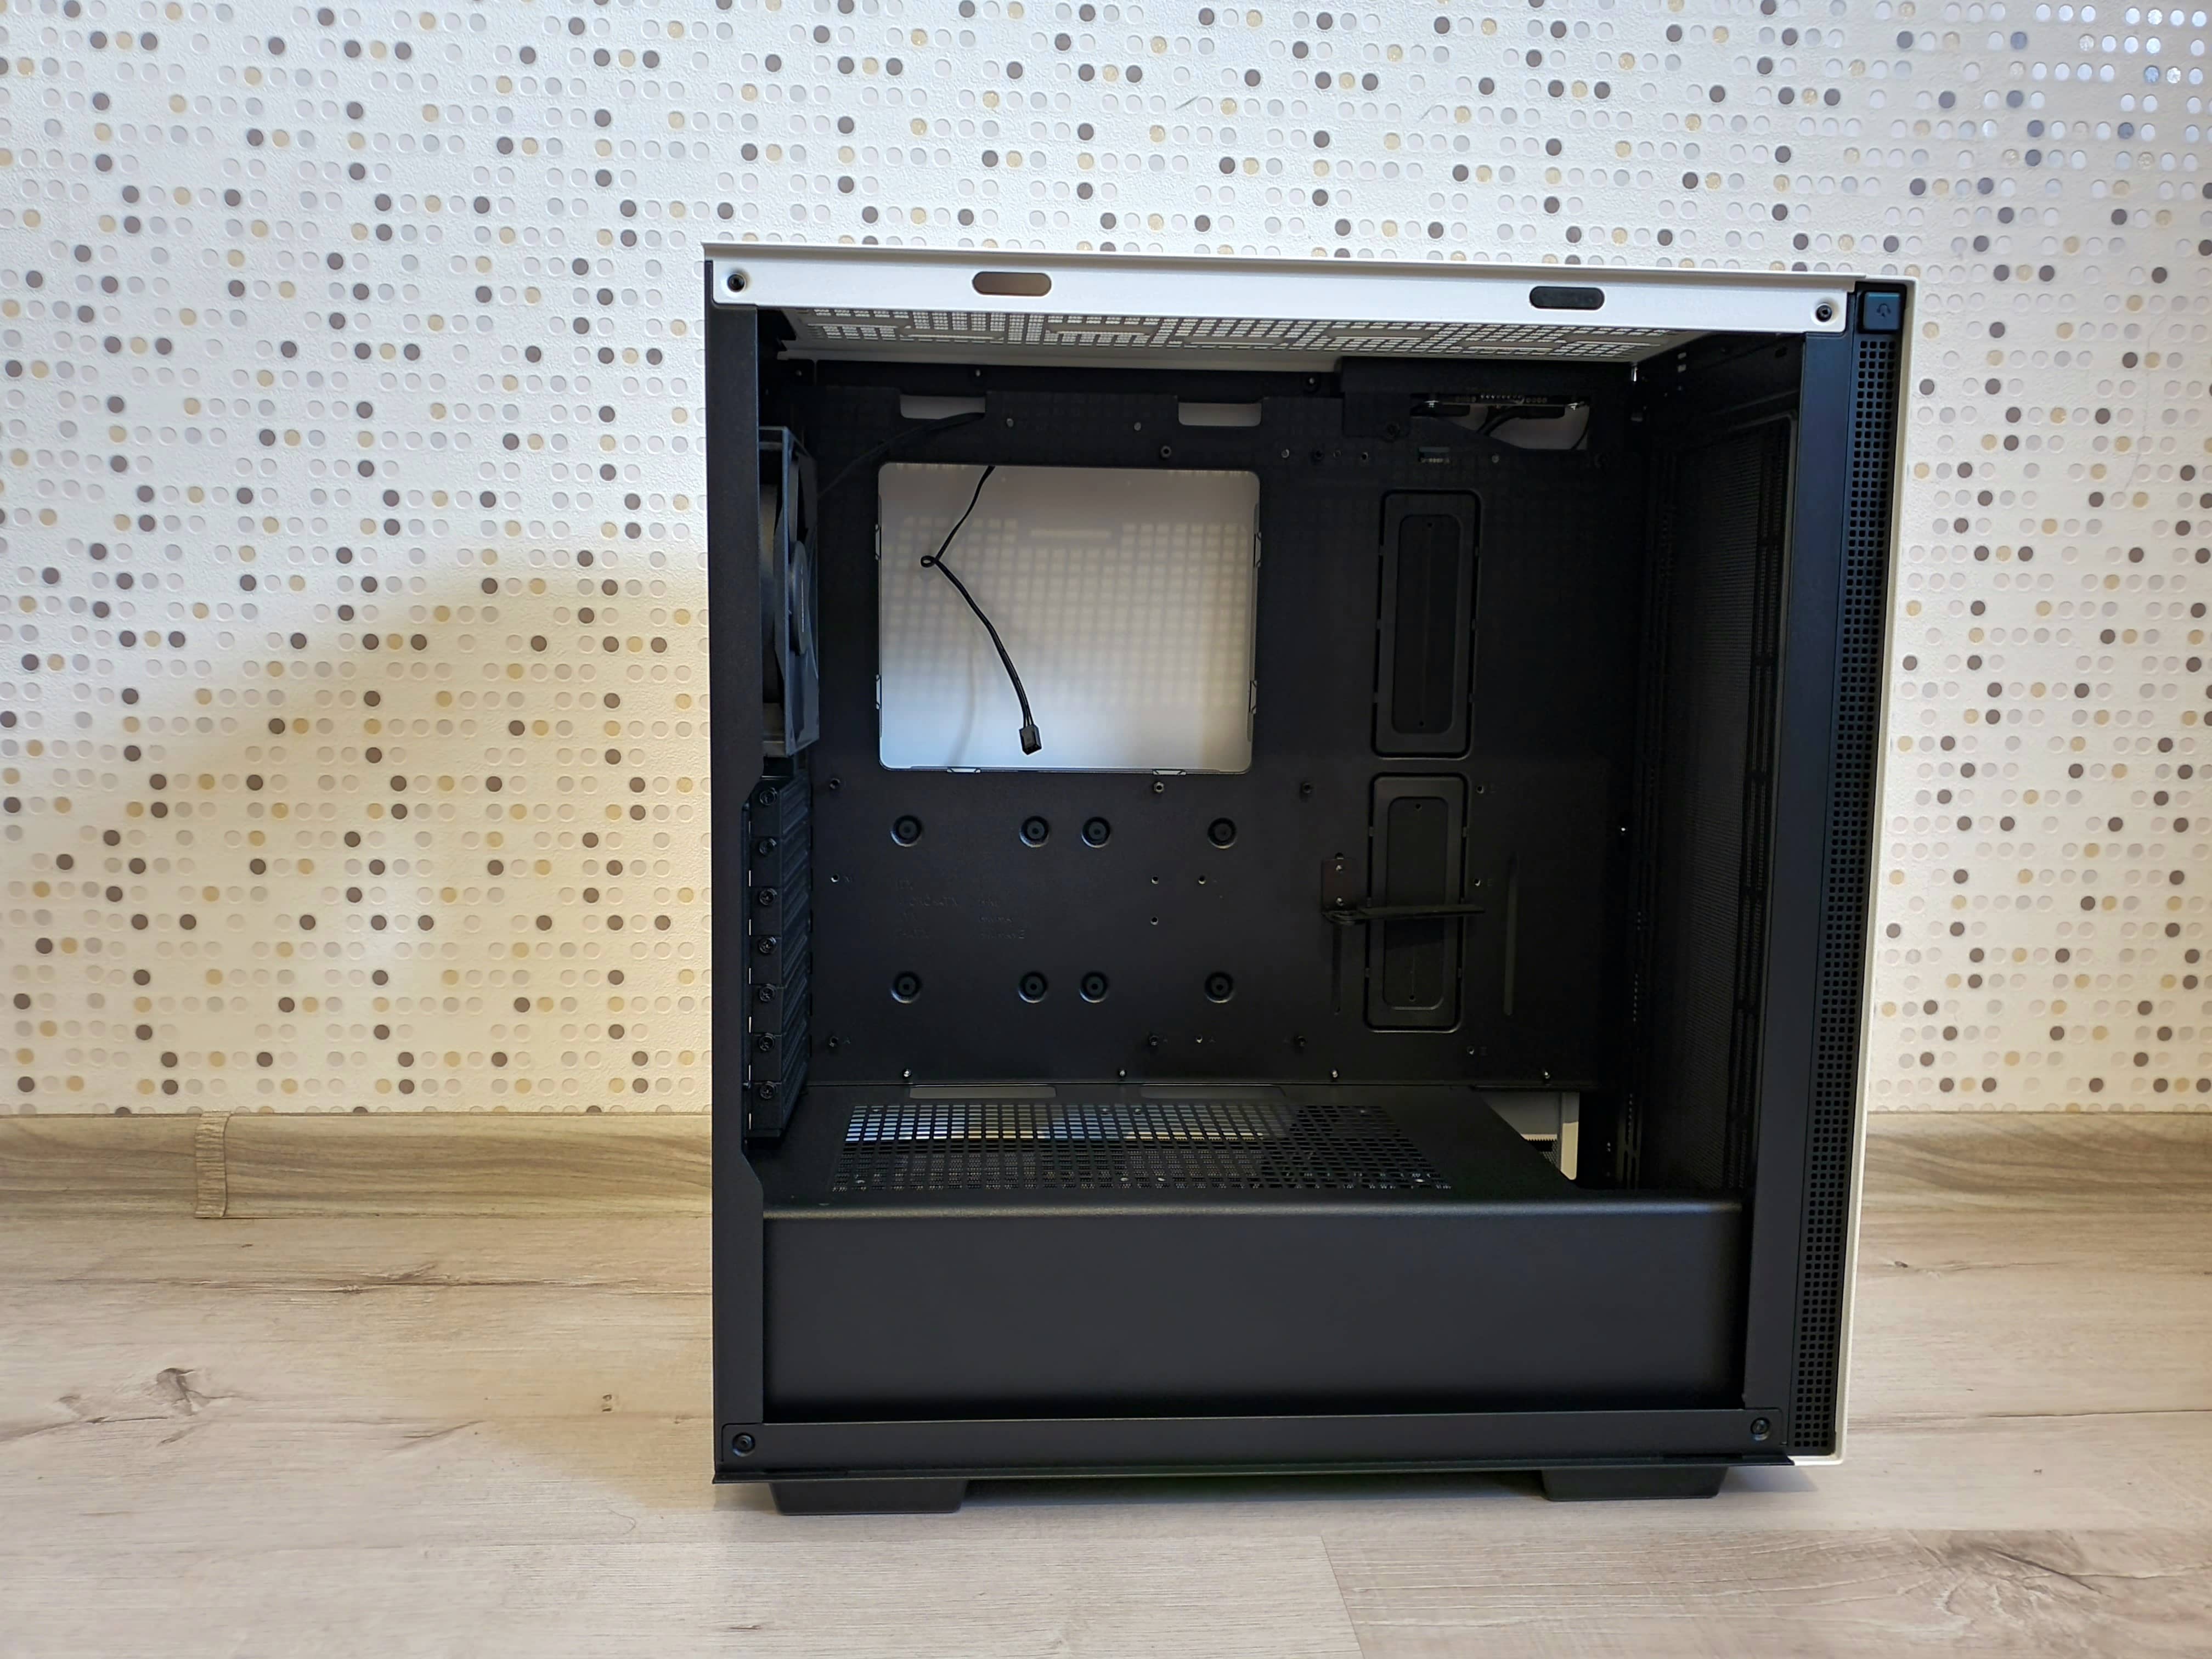
This time we're testing the case from DeepCool CH510 WH - it's an elegant and minimalistic mid-tower case with excellent component compatibility and wide cooling power support for a truly versatile build.
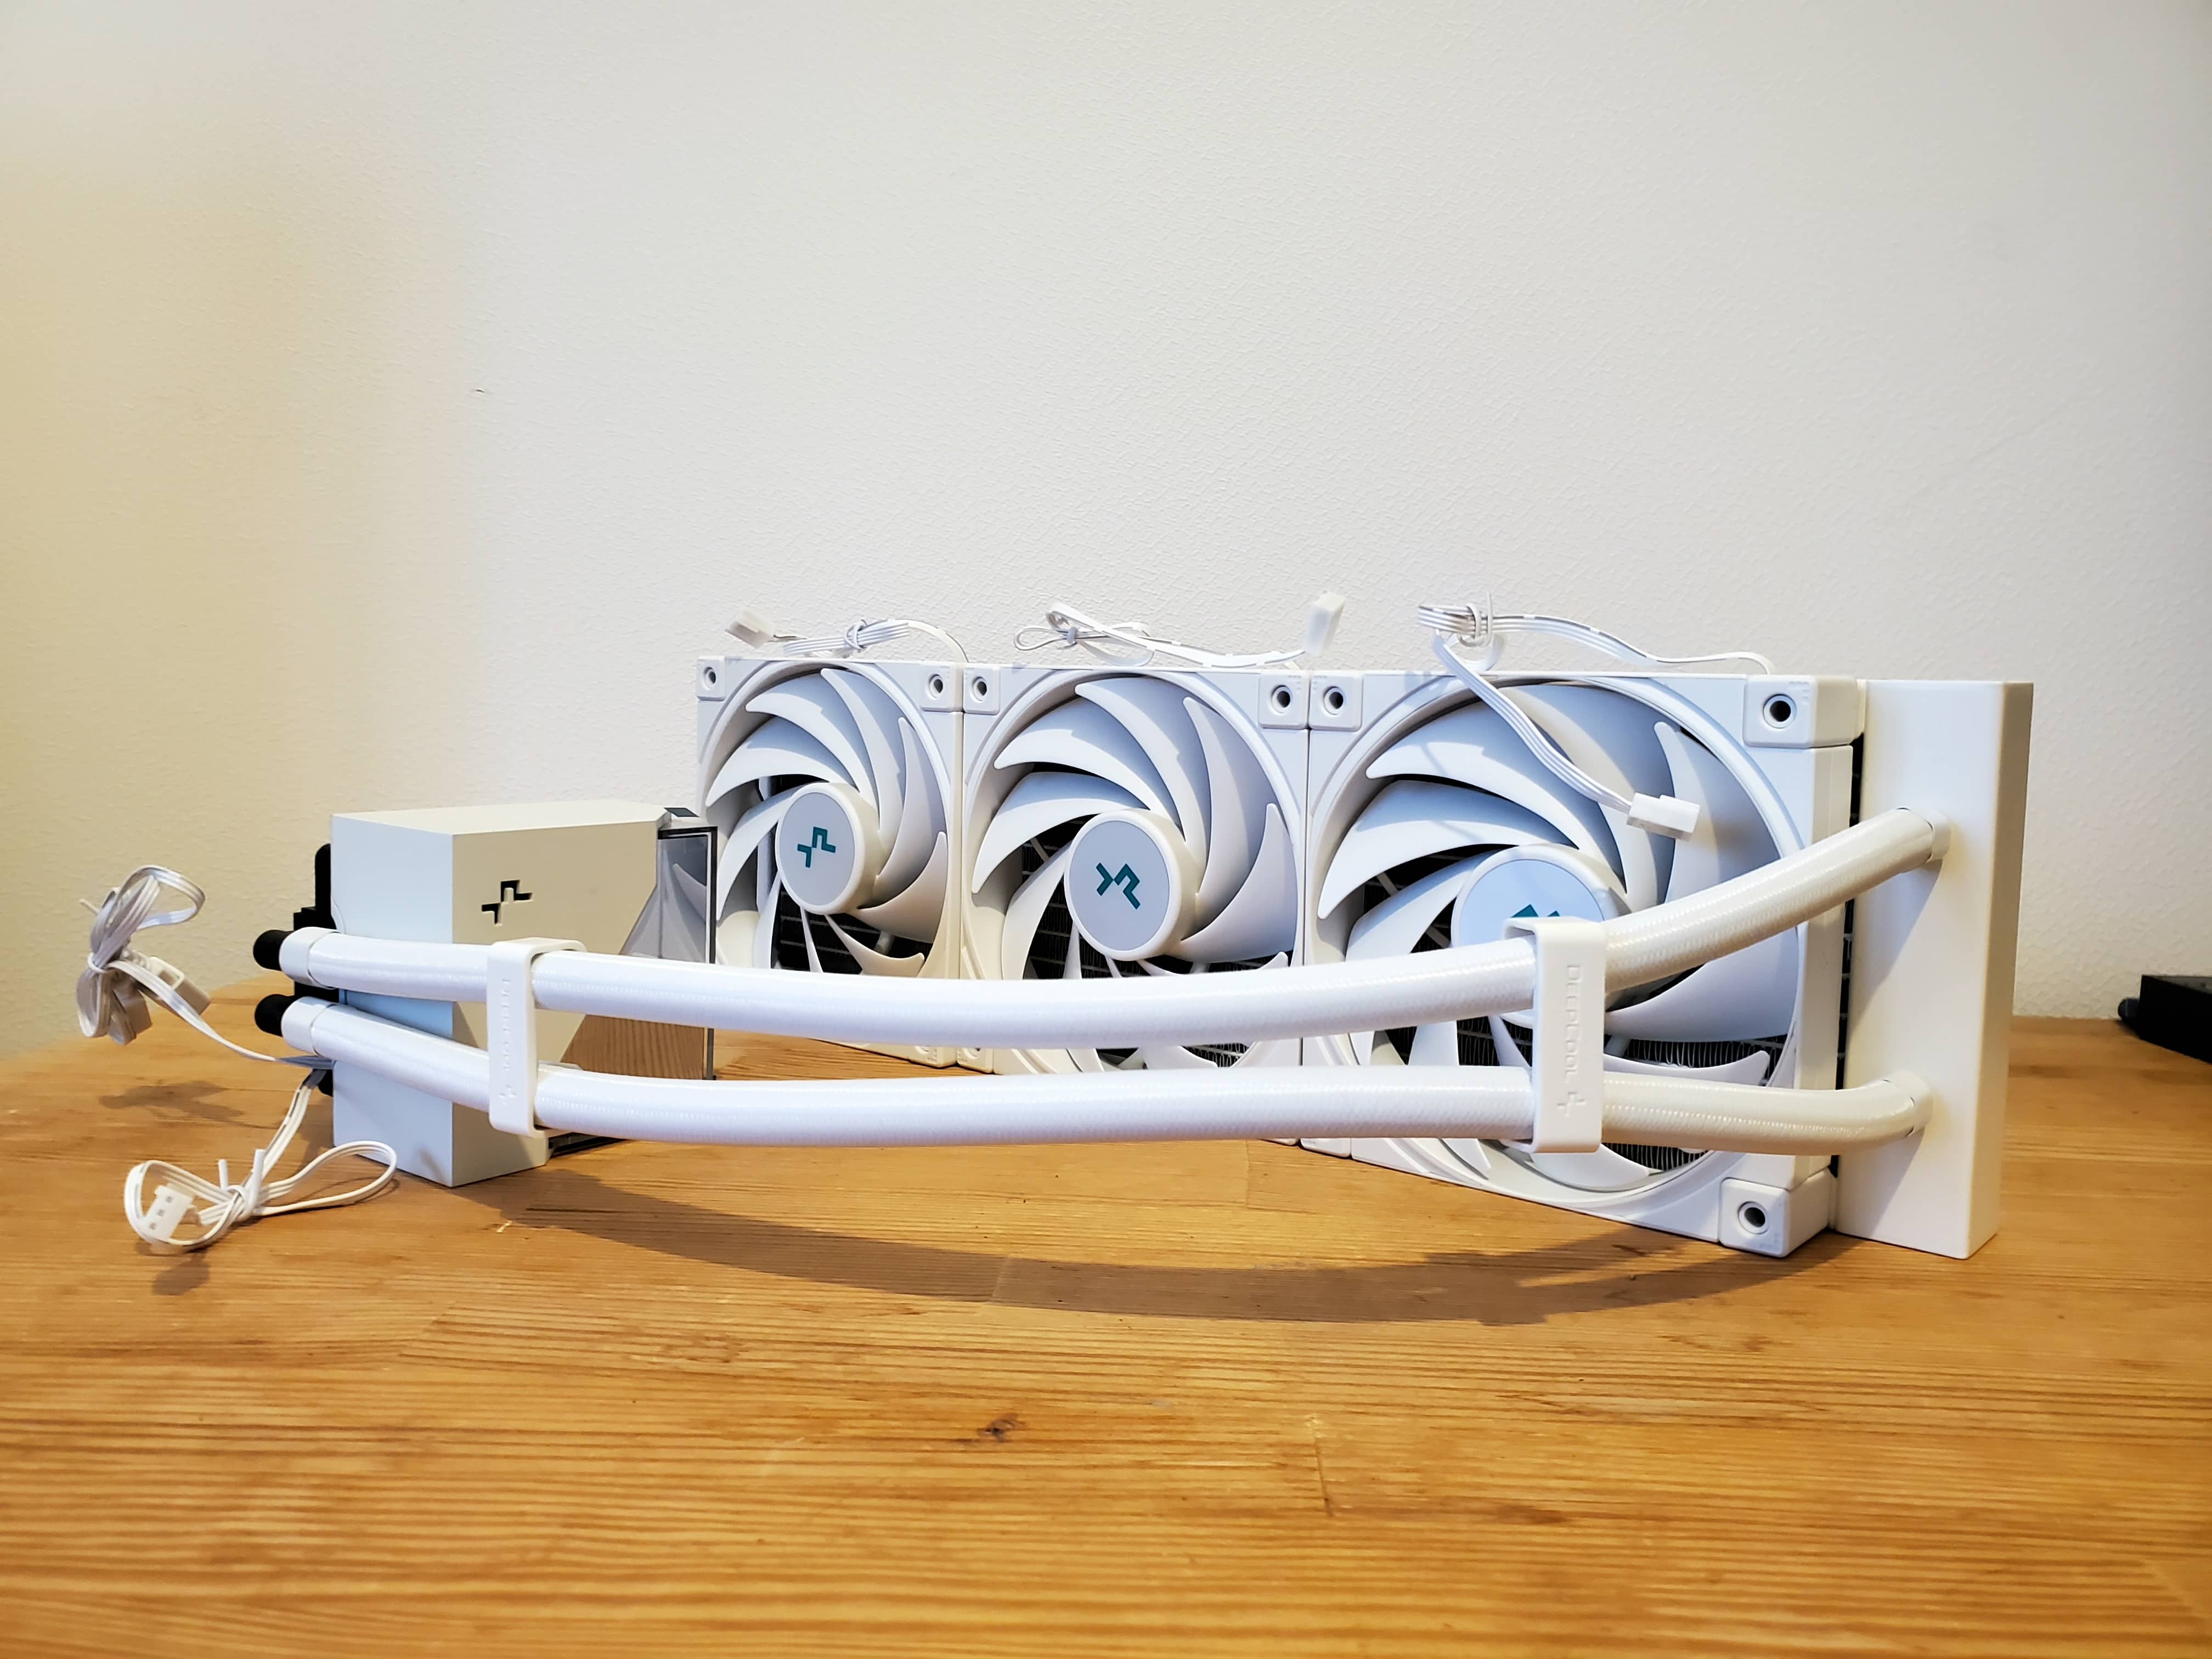
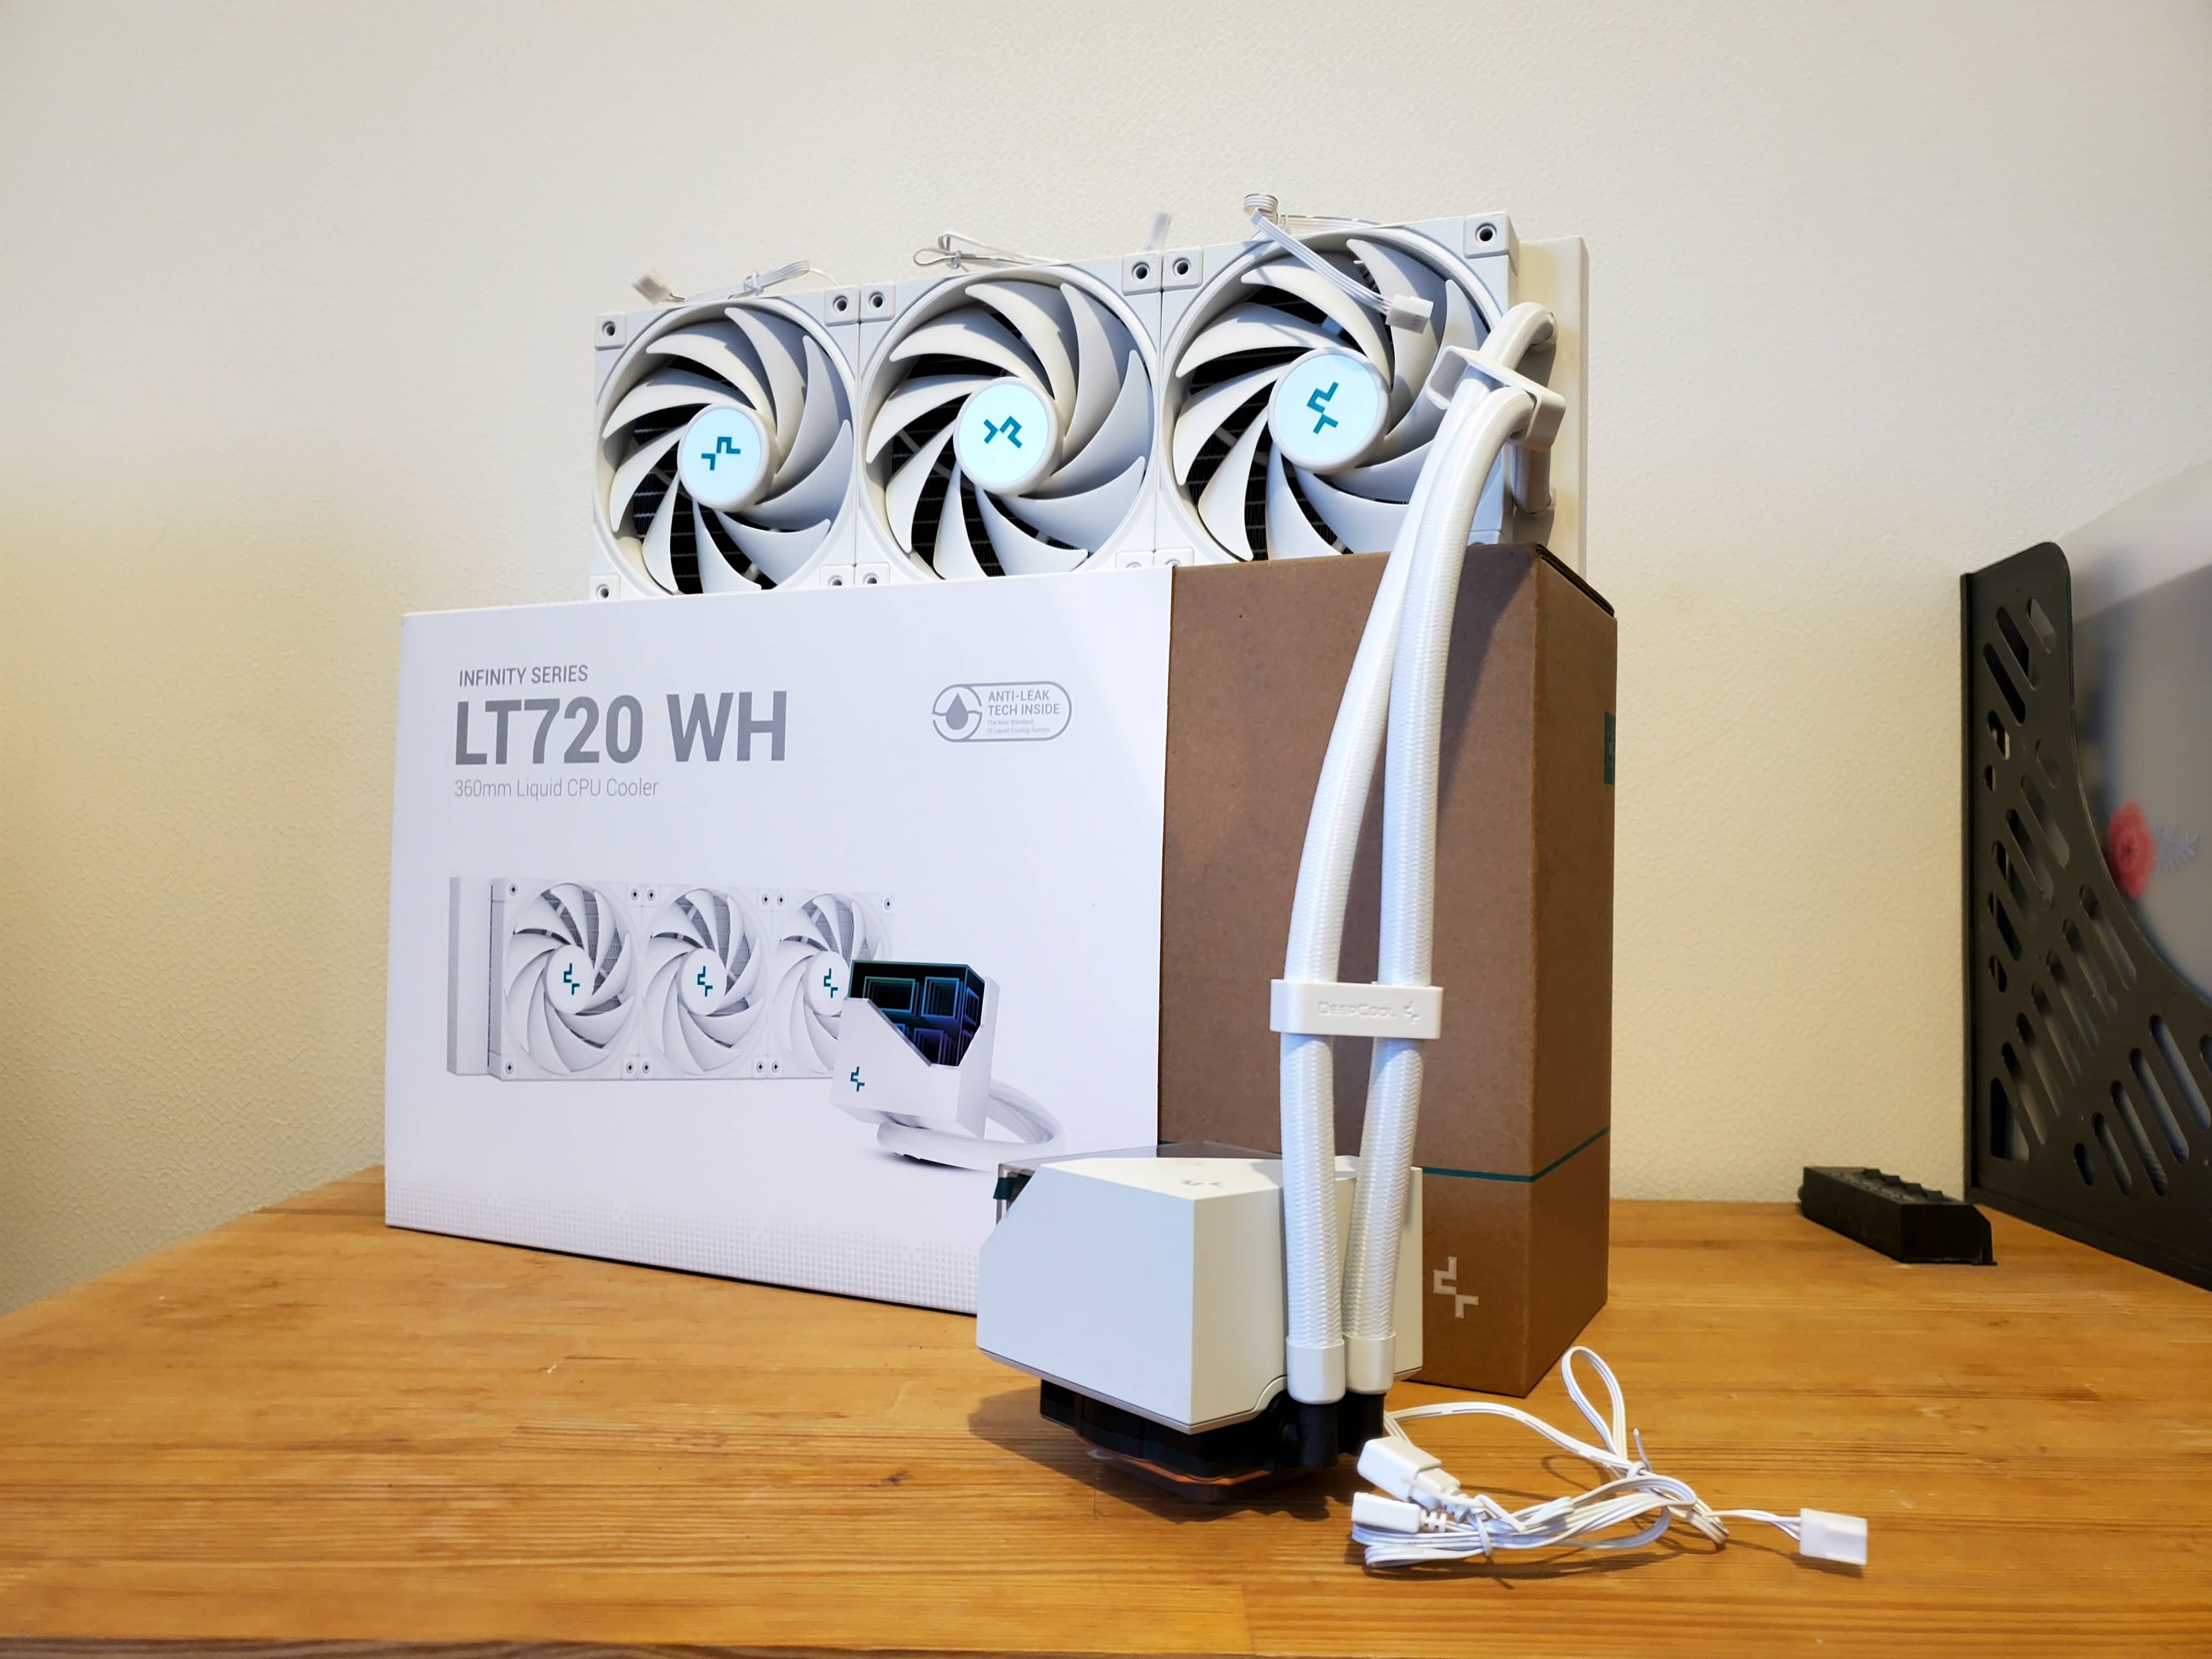
Also participating in our test this time is the premium-class DeepCool LS720 WH for processors. DeepCool LS720 WH provides maximum cooling efficiency and low noise levels, as well as a sophisticated design.
| NEW PRODUCTS PROVIDED FOR TESTS BY GIGABYTE |
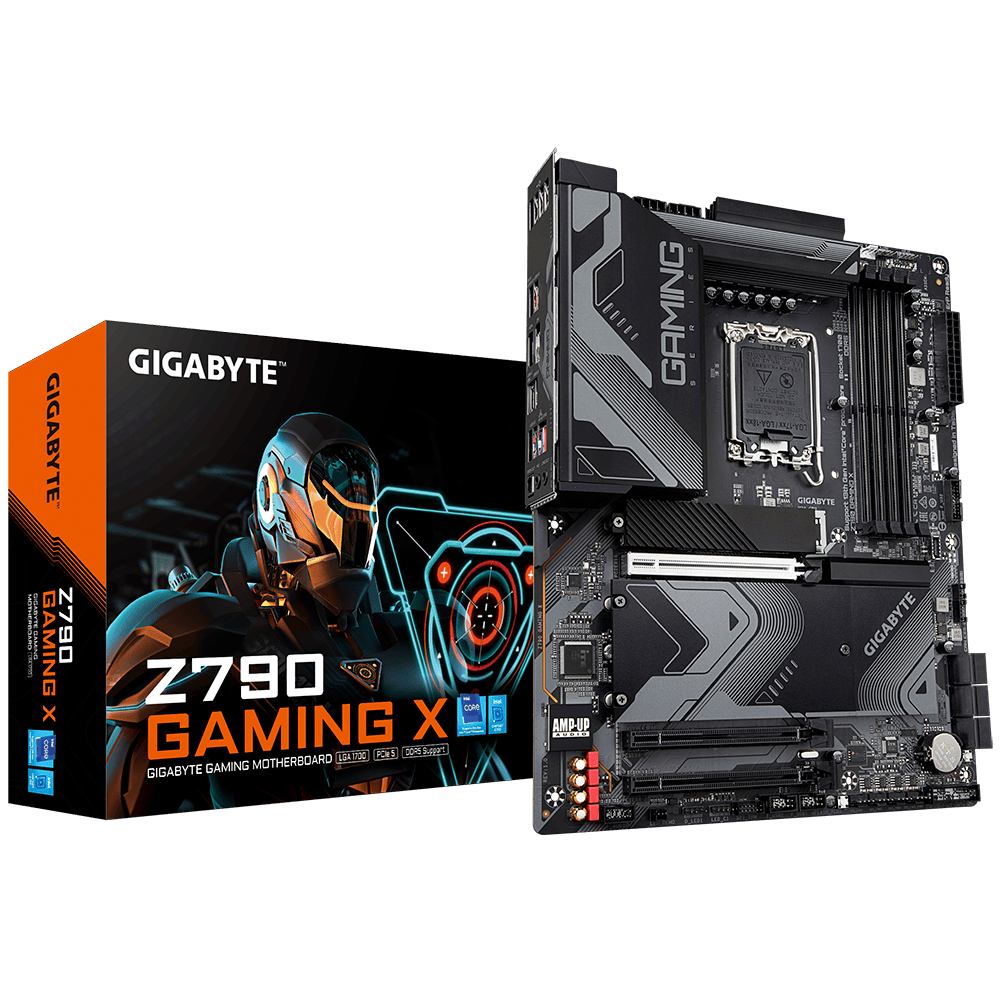
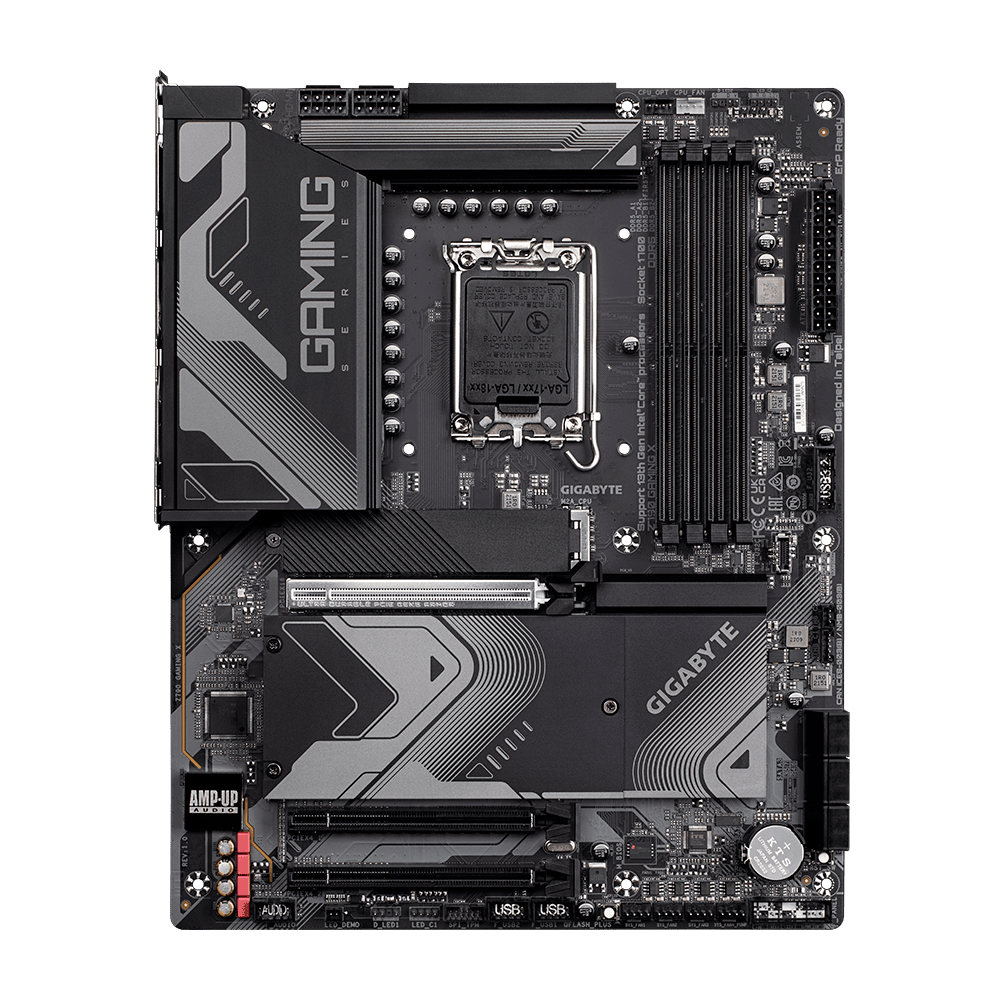
In our review, we present to you the GIGABYTE Z790 GAMING X AX motherboards . We use this motherboard as a test bench for testing new generations of Intel processors .
This time our test involves the company's top-end video card Gigabyte GeForce RTX 4060 Ti GAMING OC . Its testing on our website.
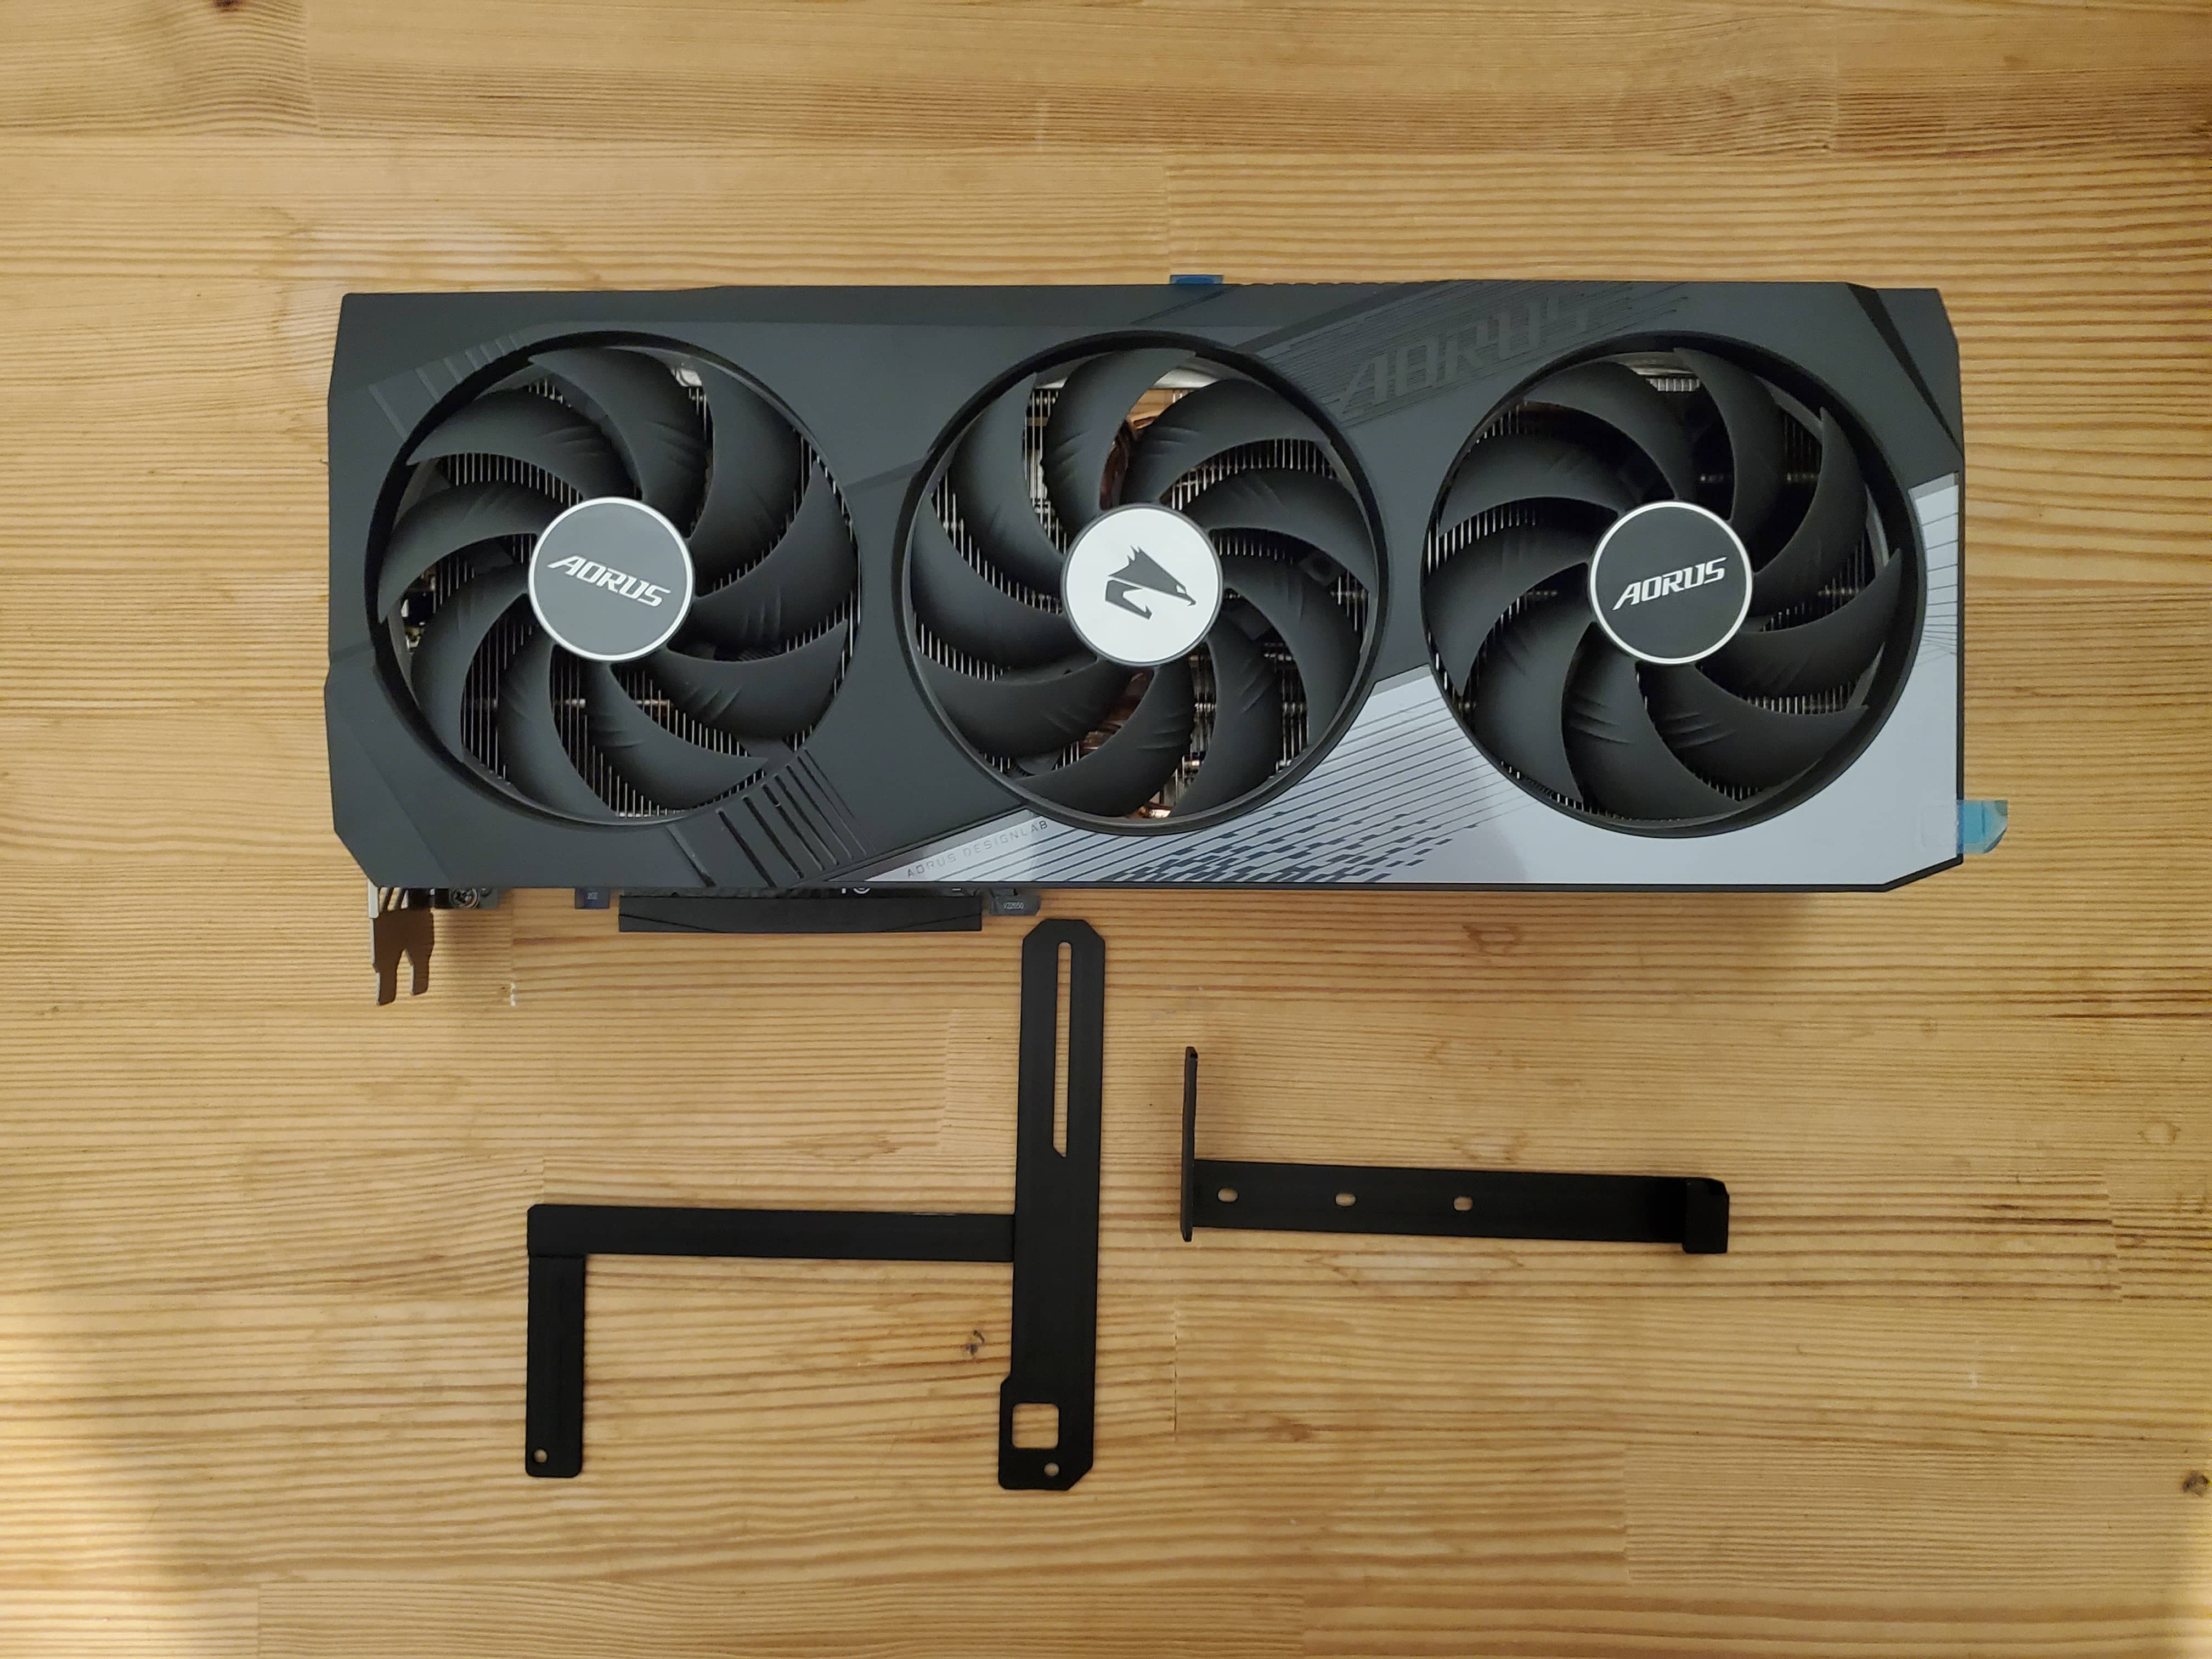
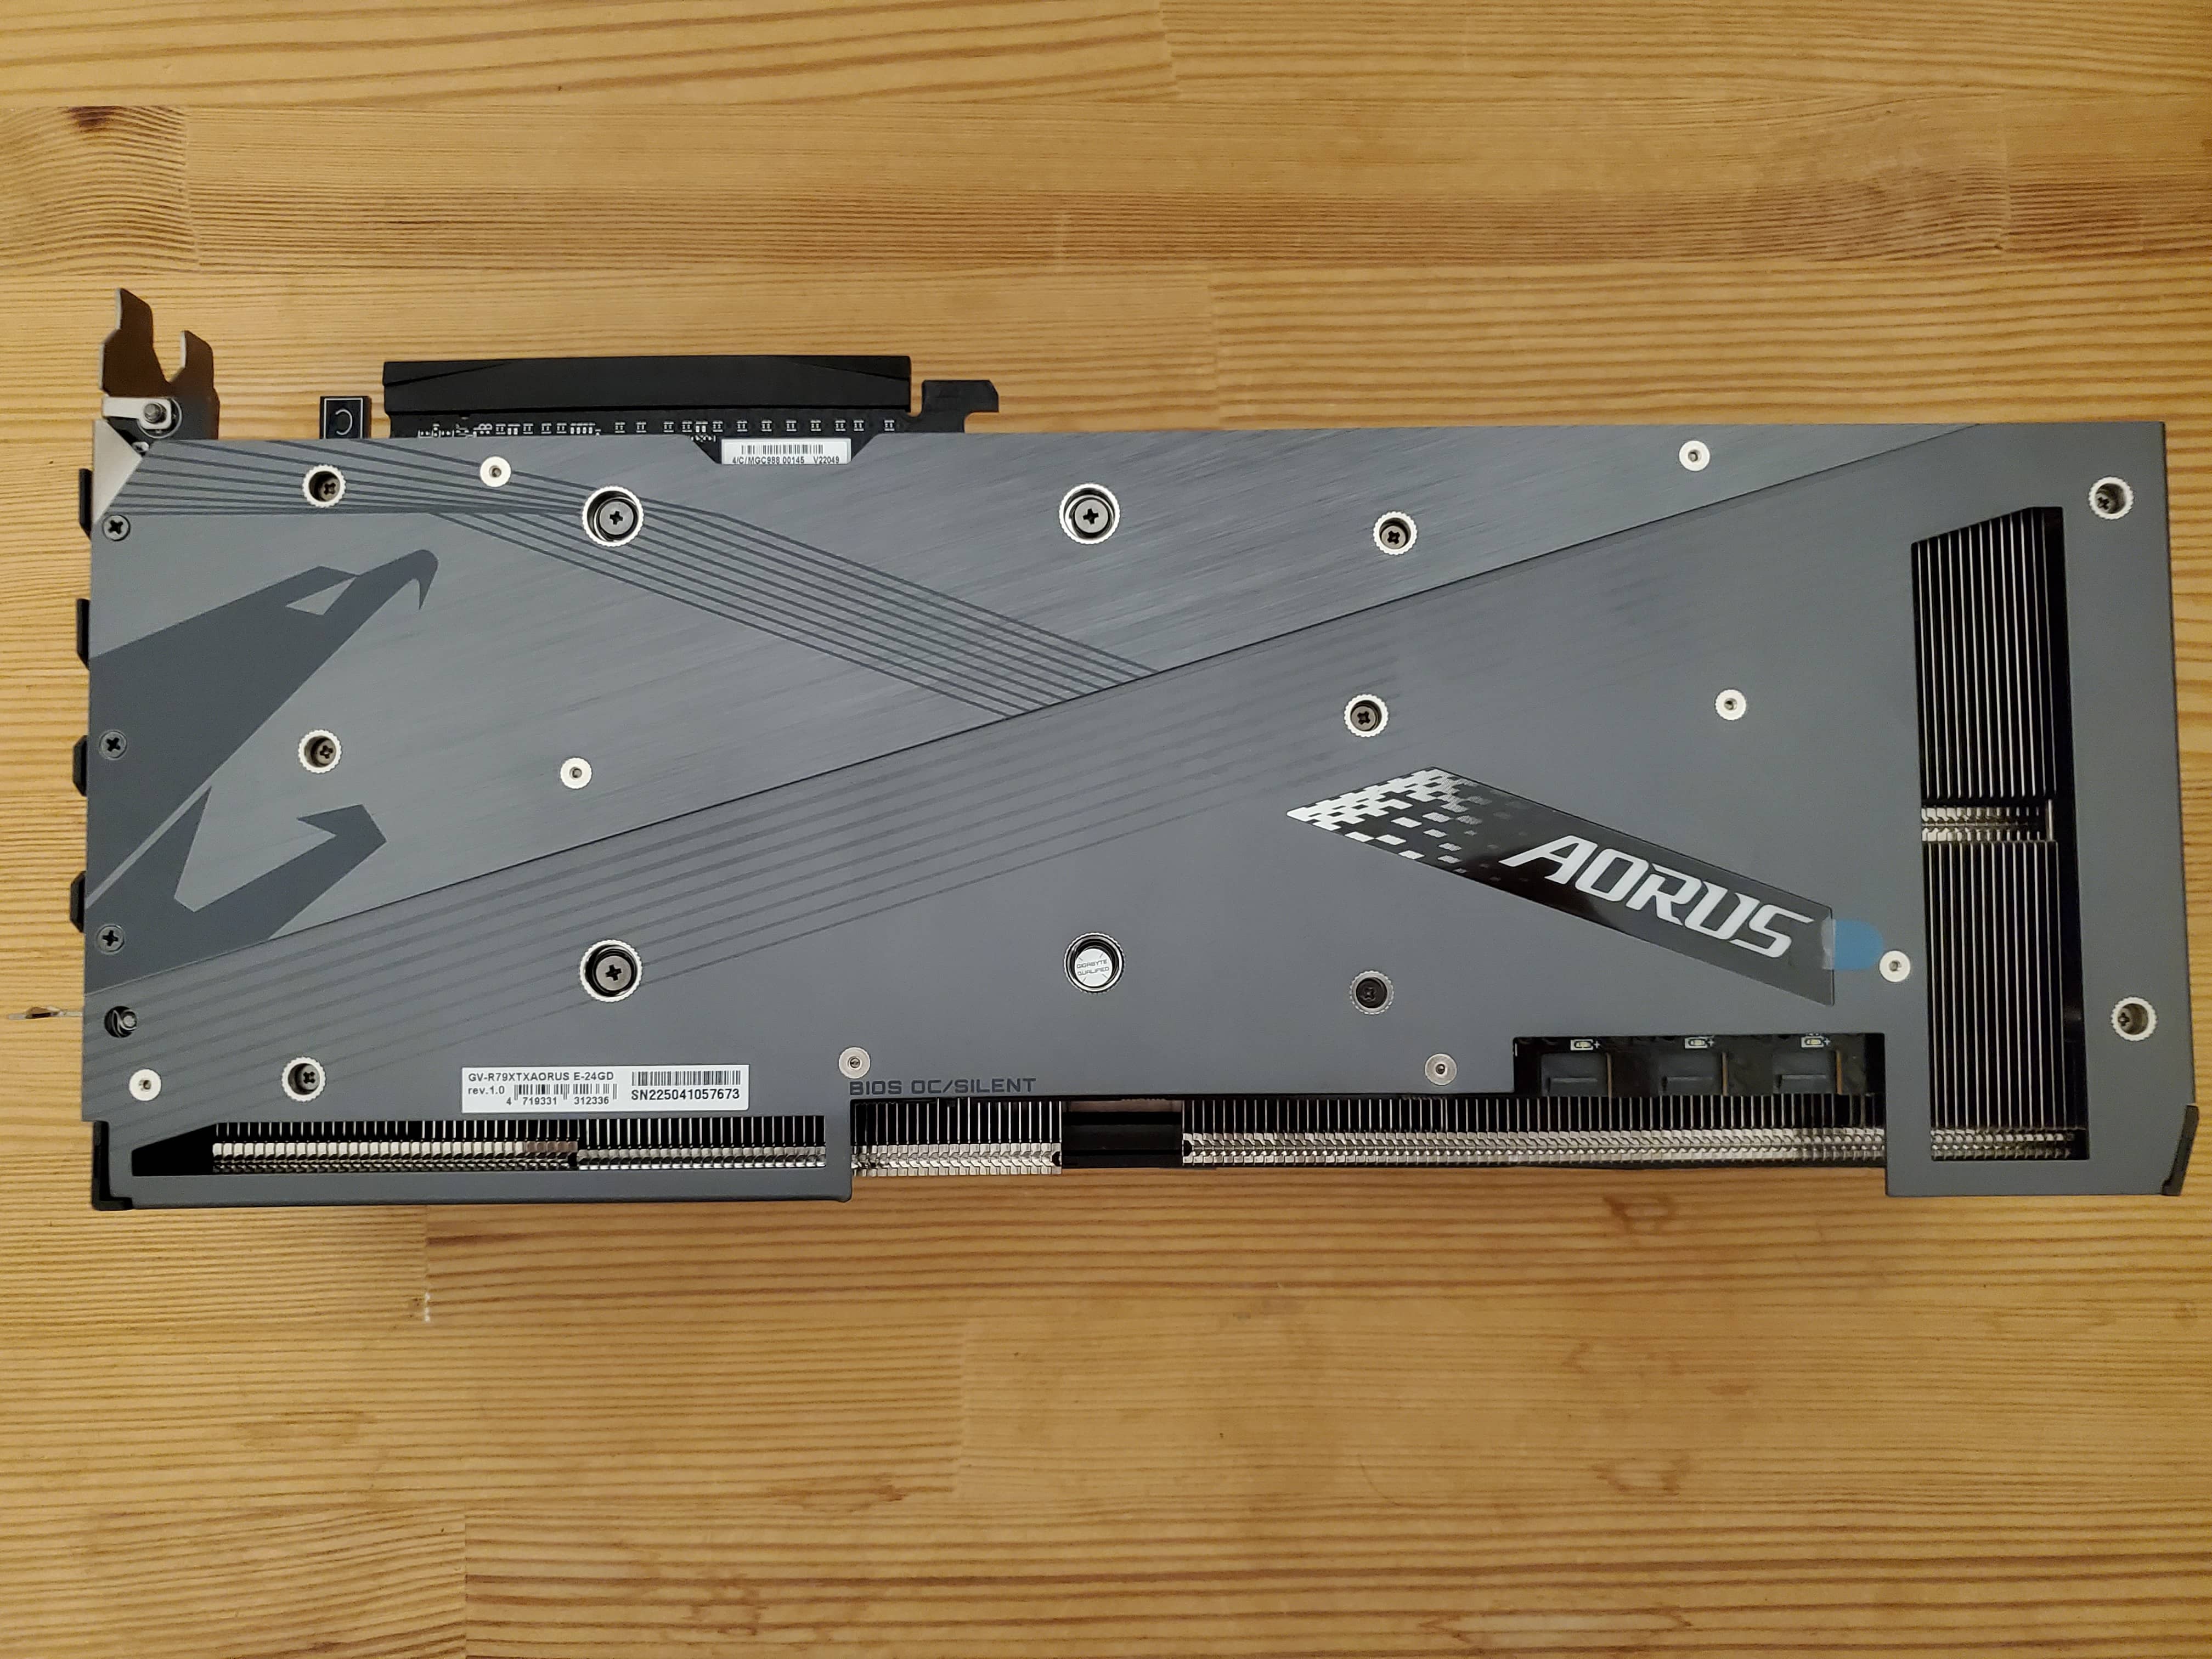
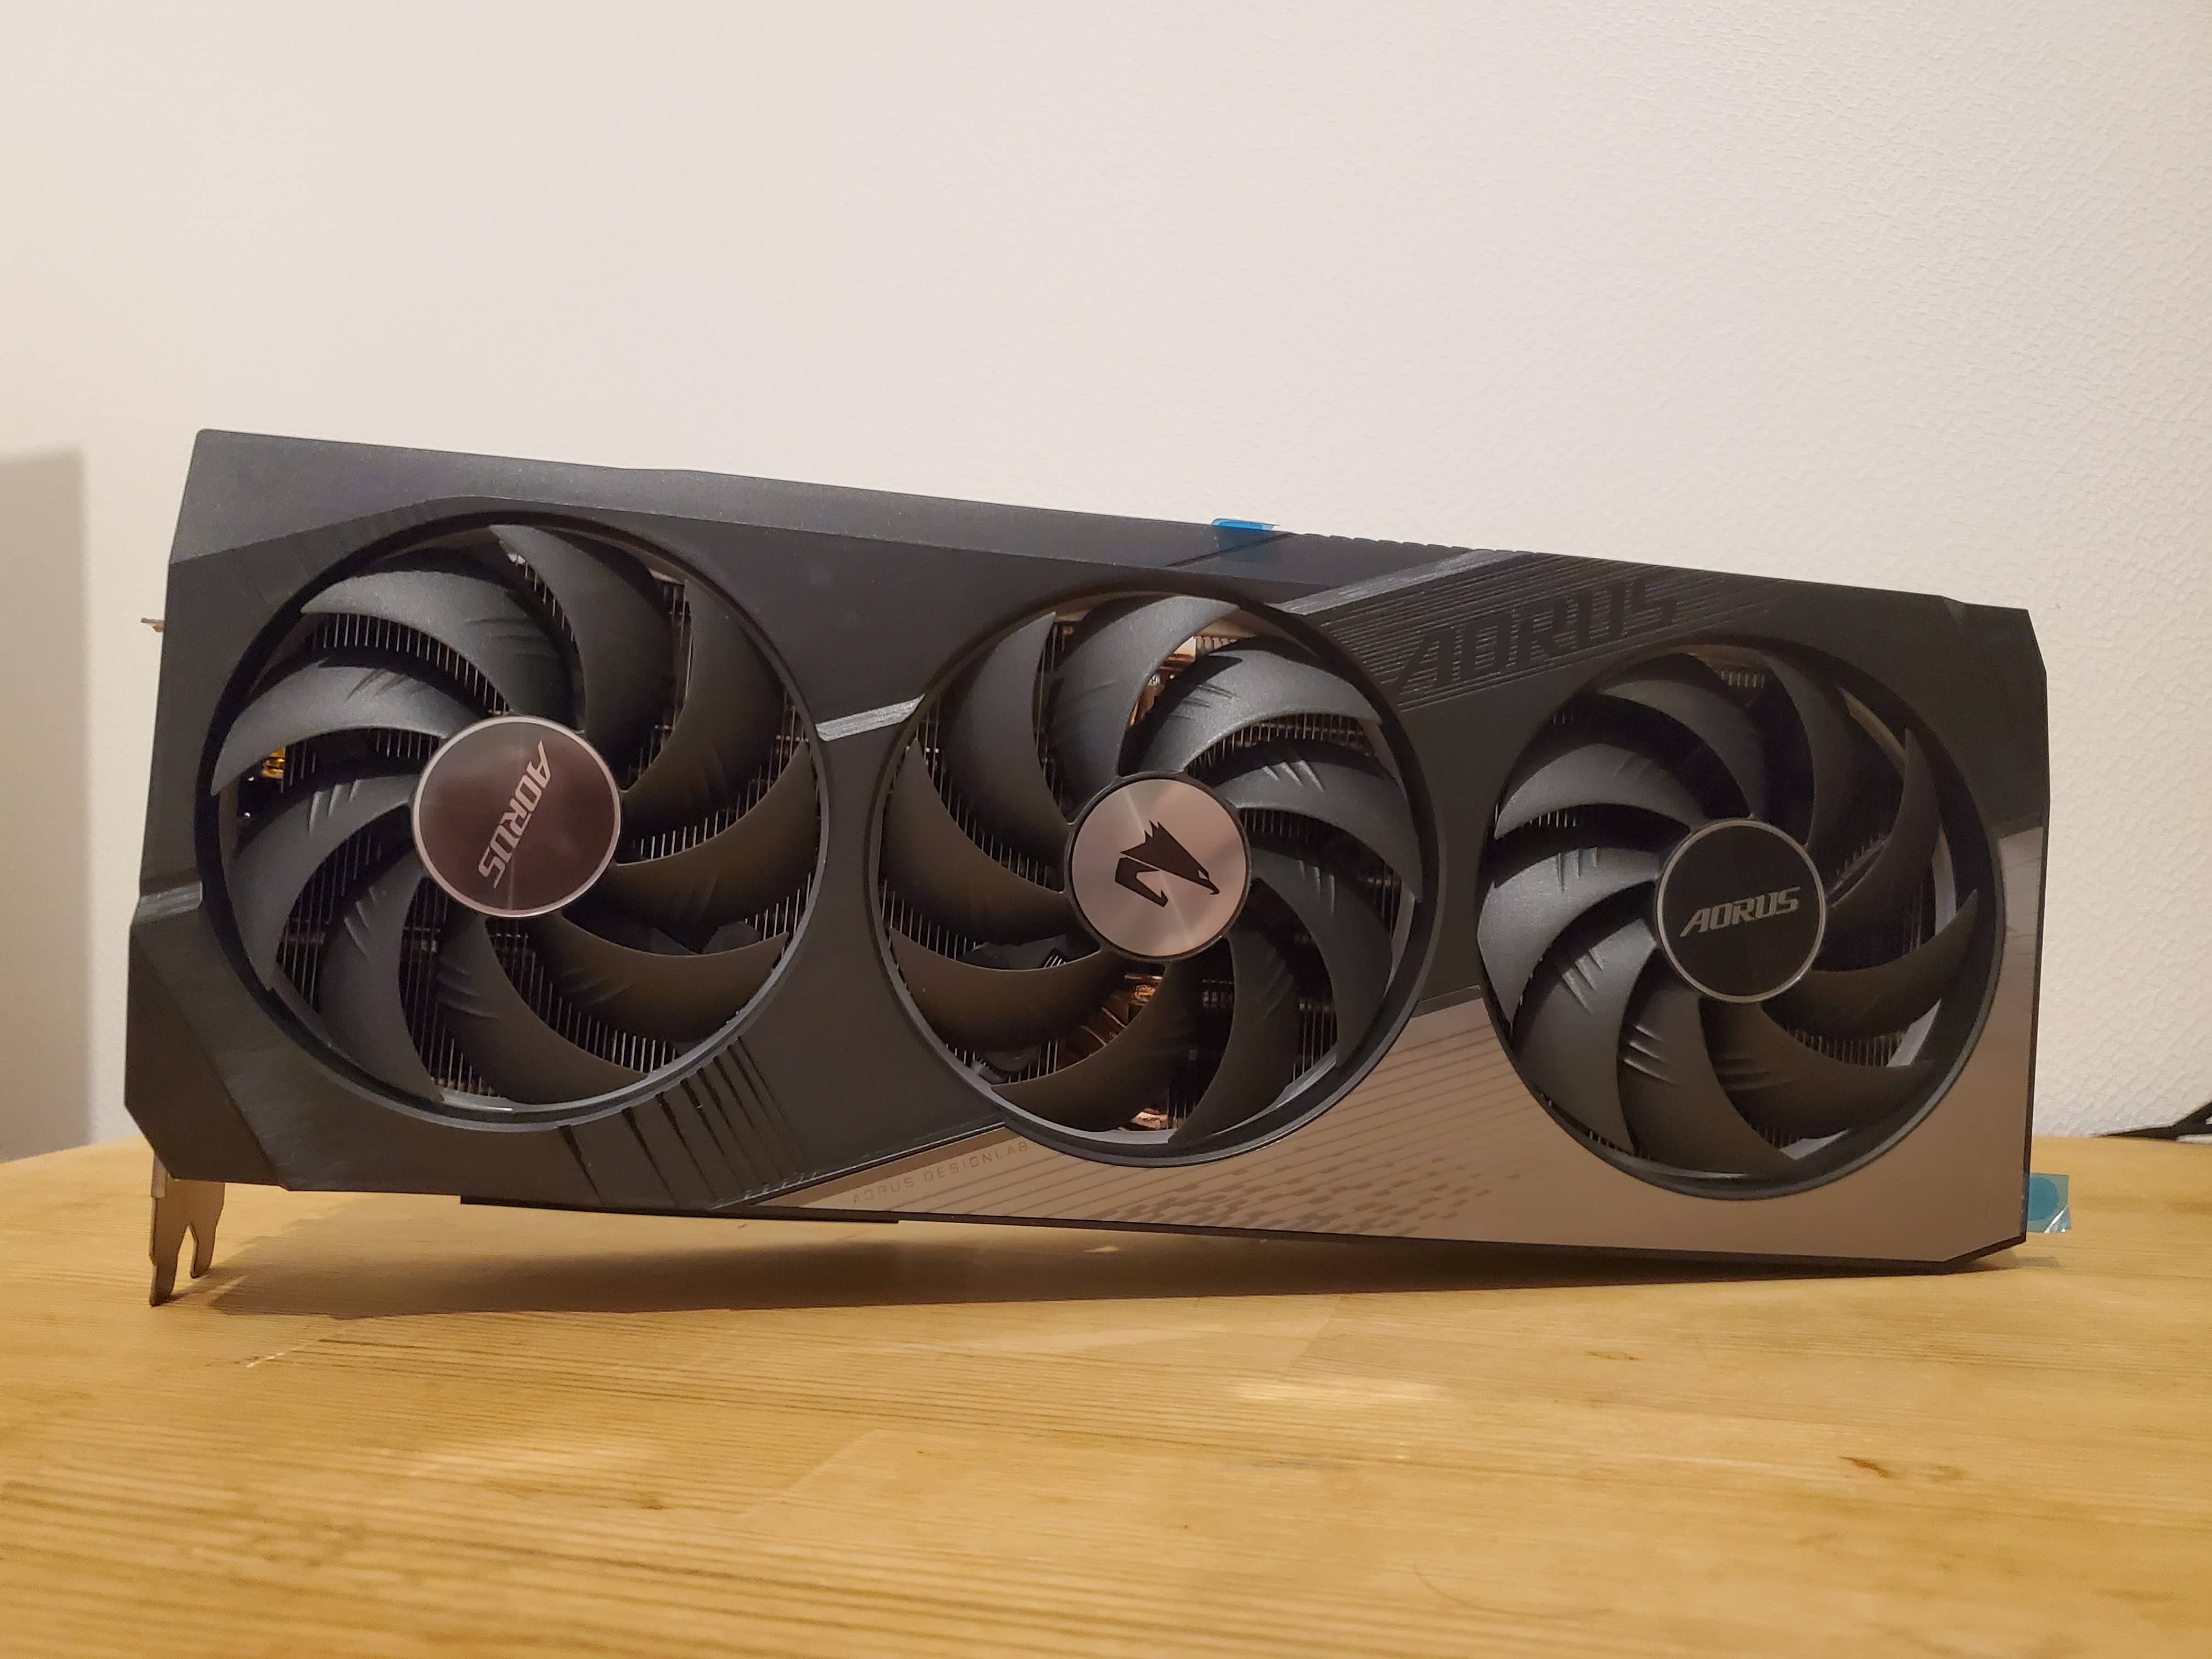
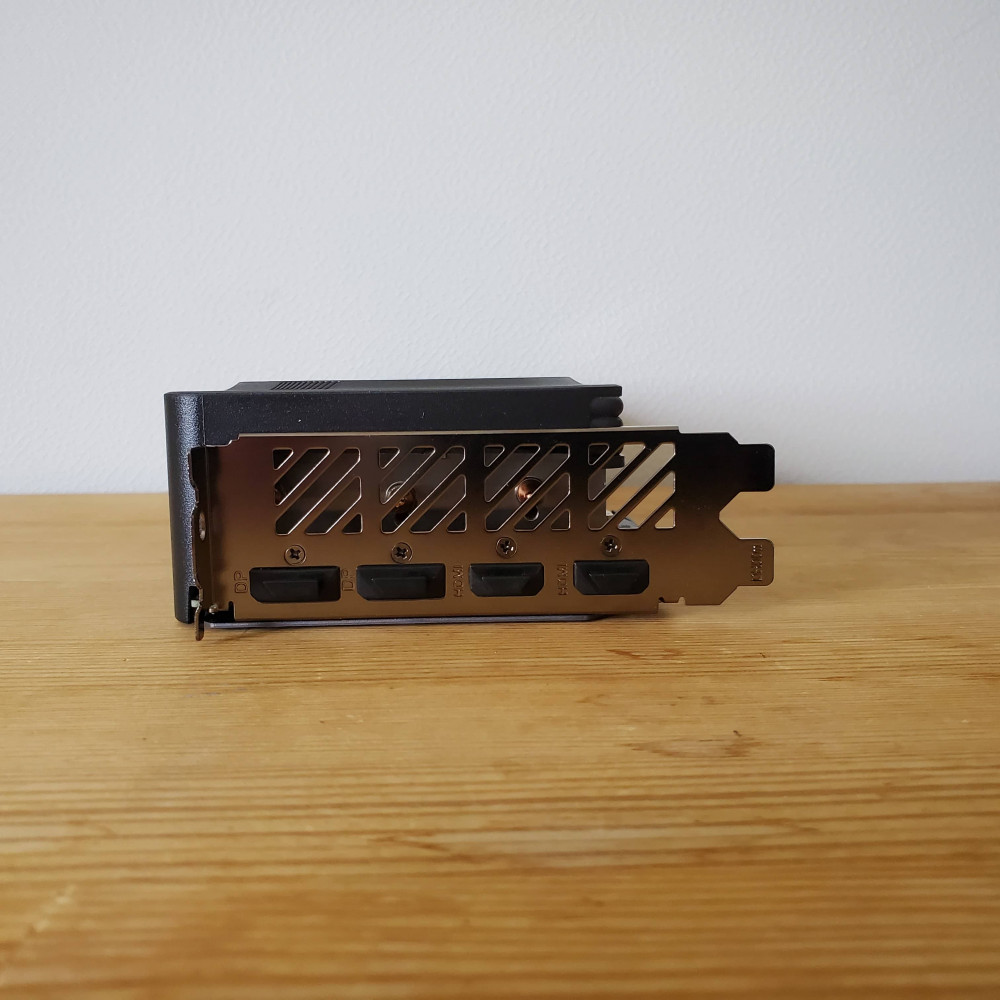
This time our test involves the company's top-end video card, AORUS Radeon RX 7900 XTX ELITE 24G. This video card is based on the RDNA 3 architecture, operates at a frequency of 3000 MHz and has 24 gigabytes of video memory. Its testing on our website.
| NEW PRODUCTS PROVIDED FOR TESTS BY KINGSTON |
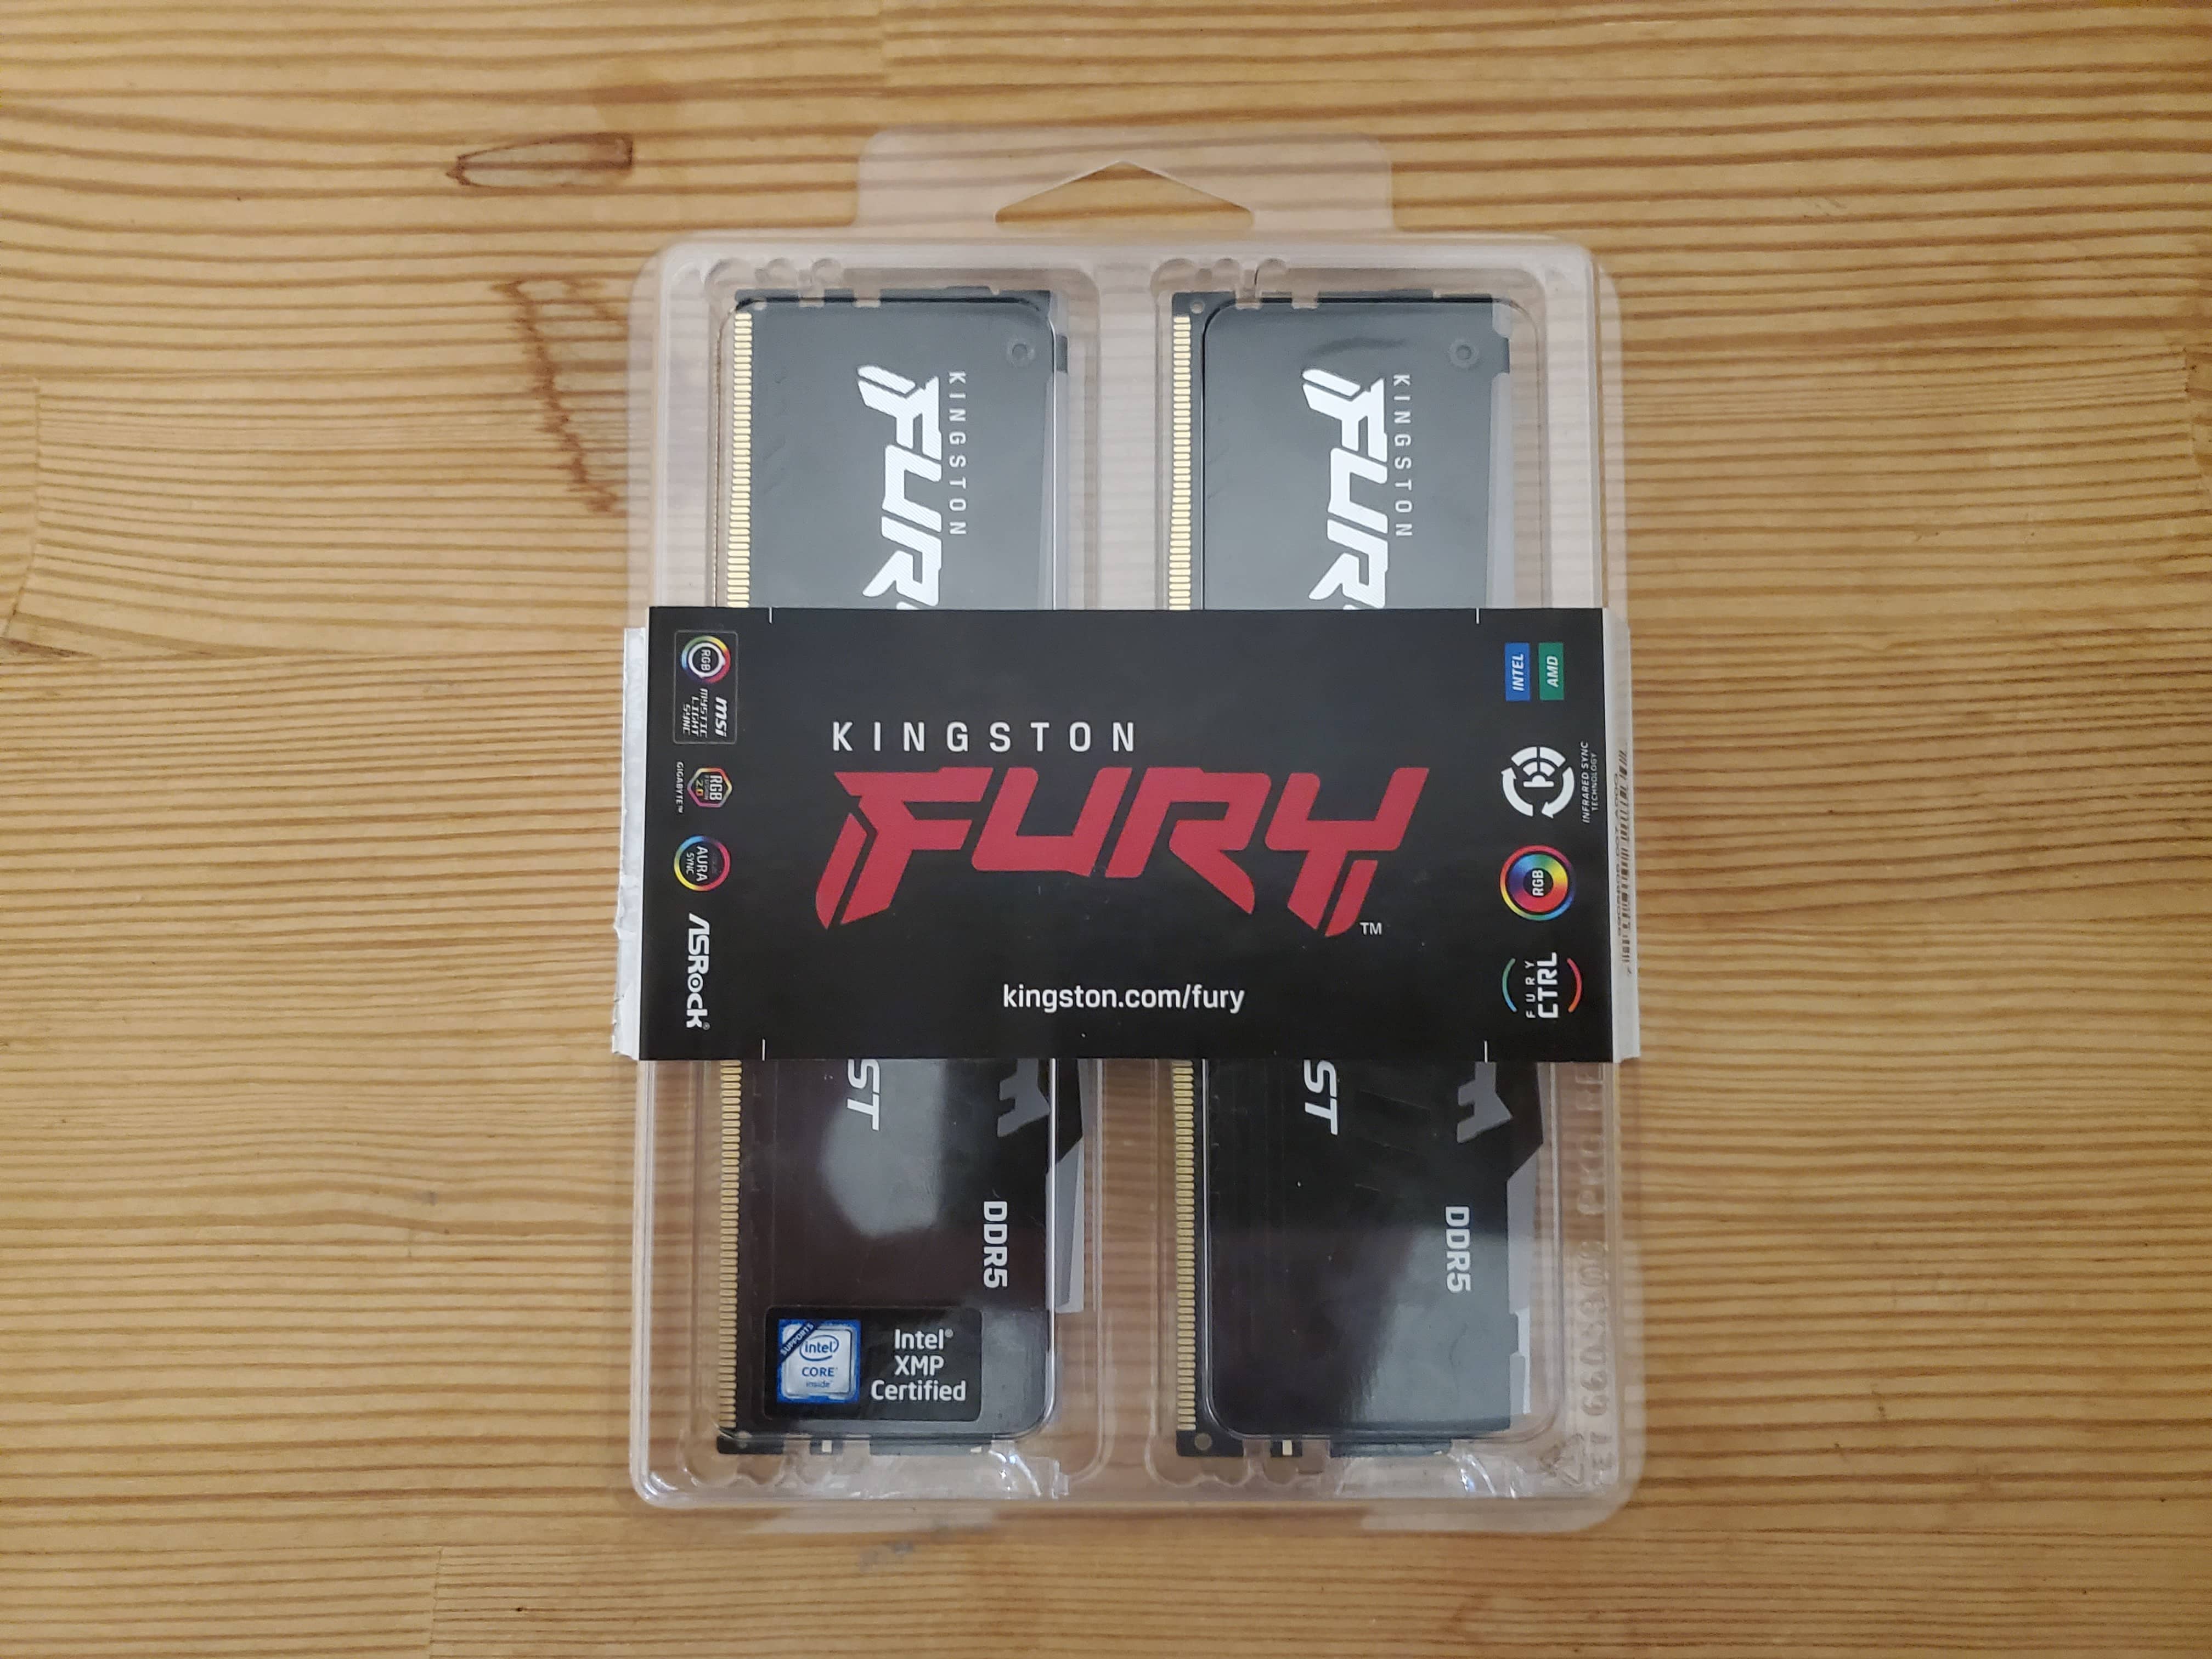
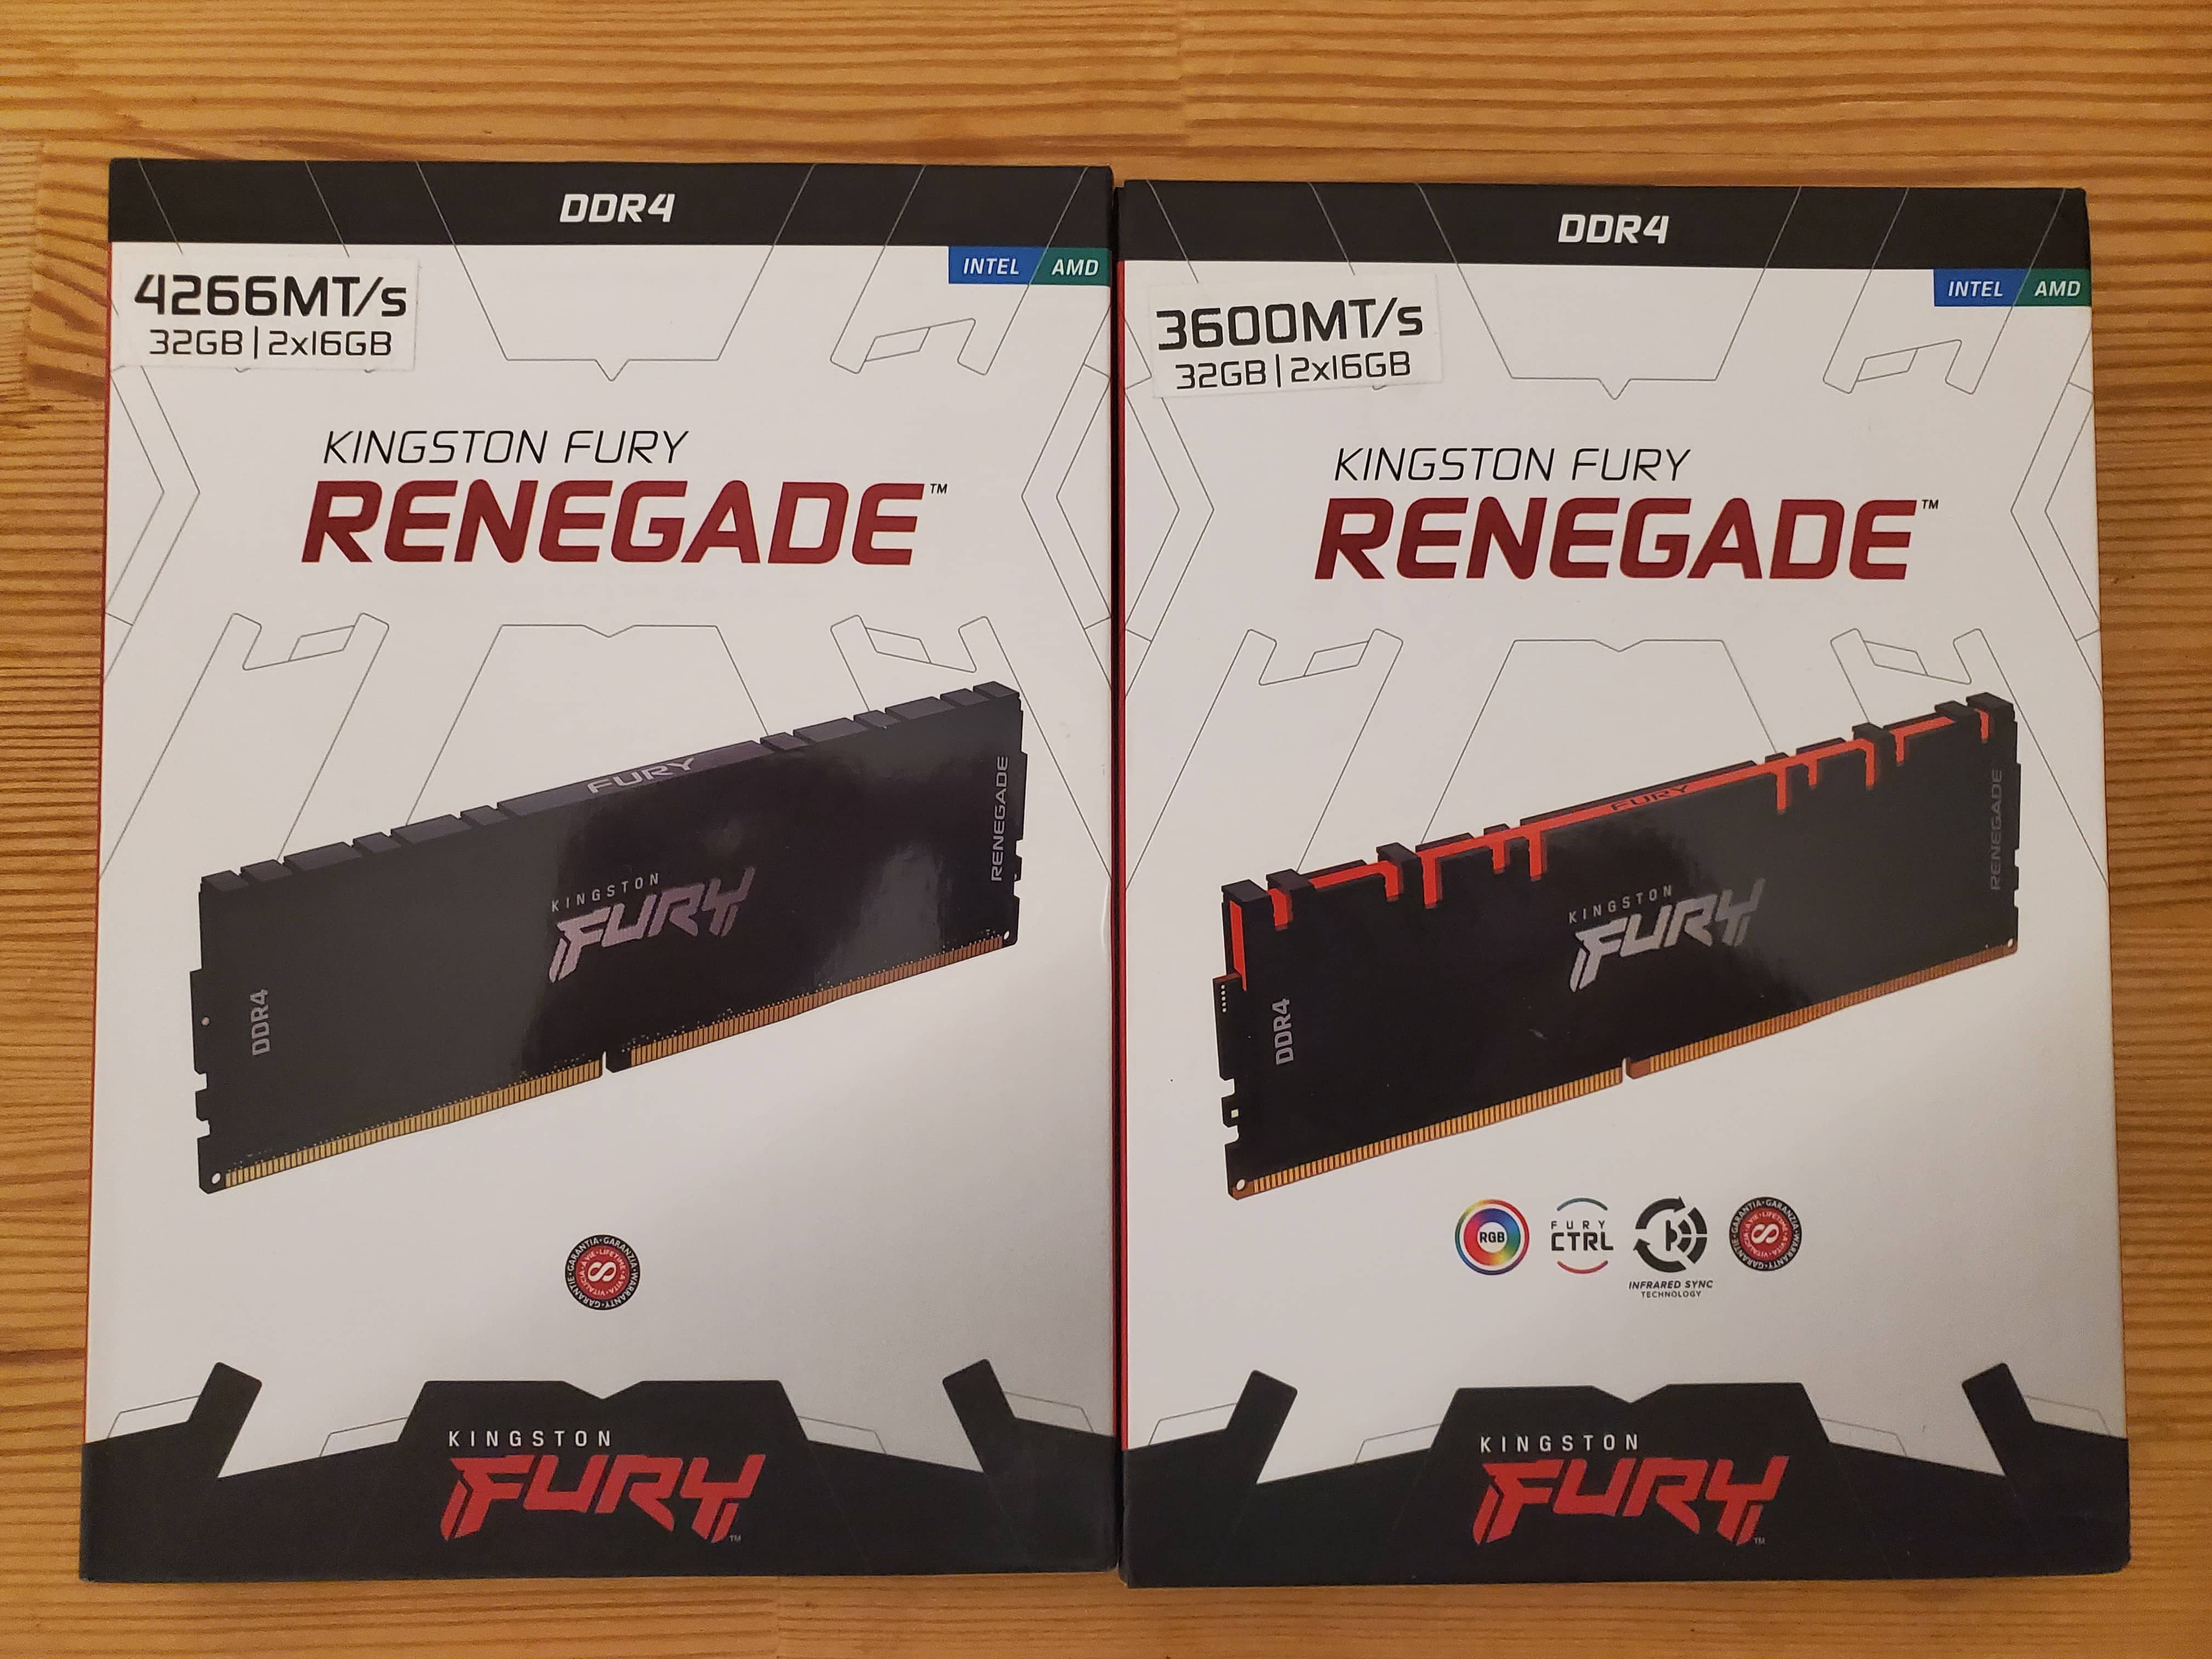
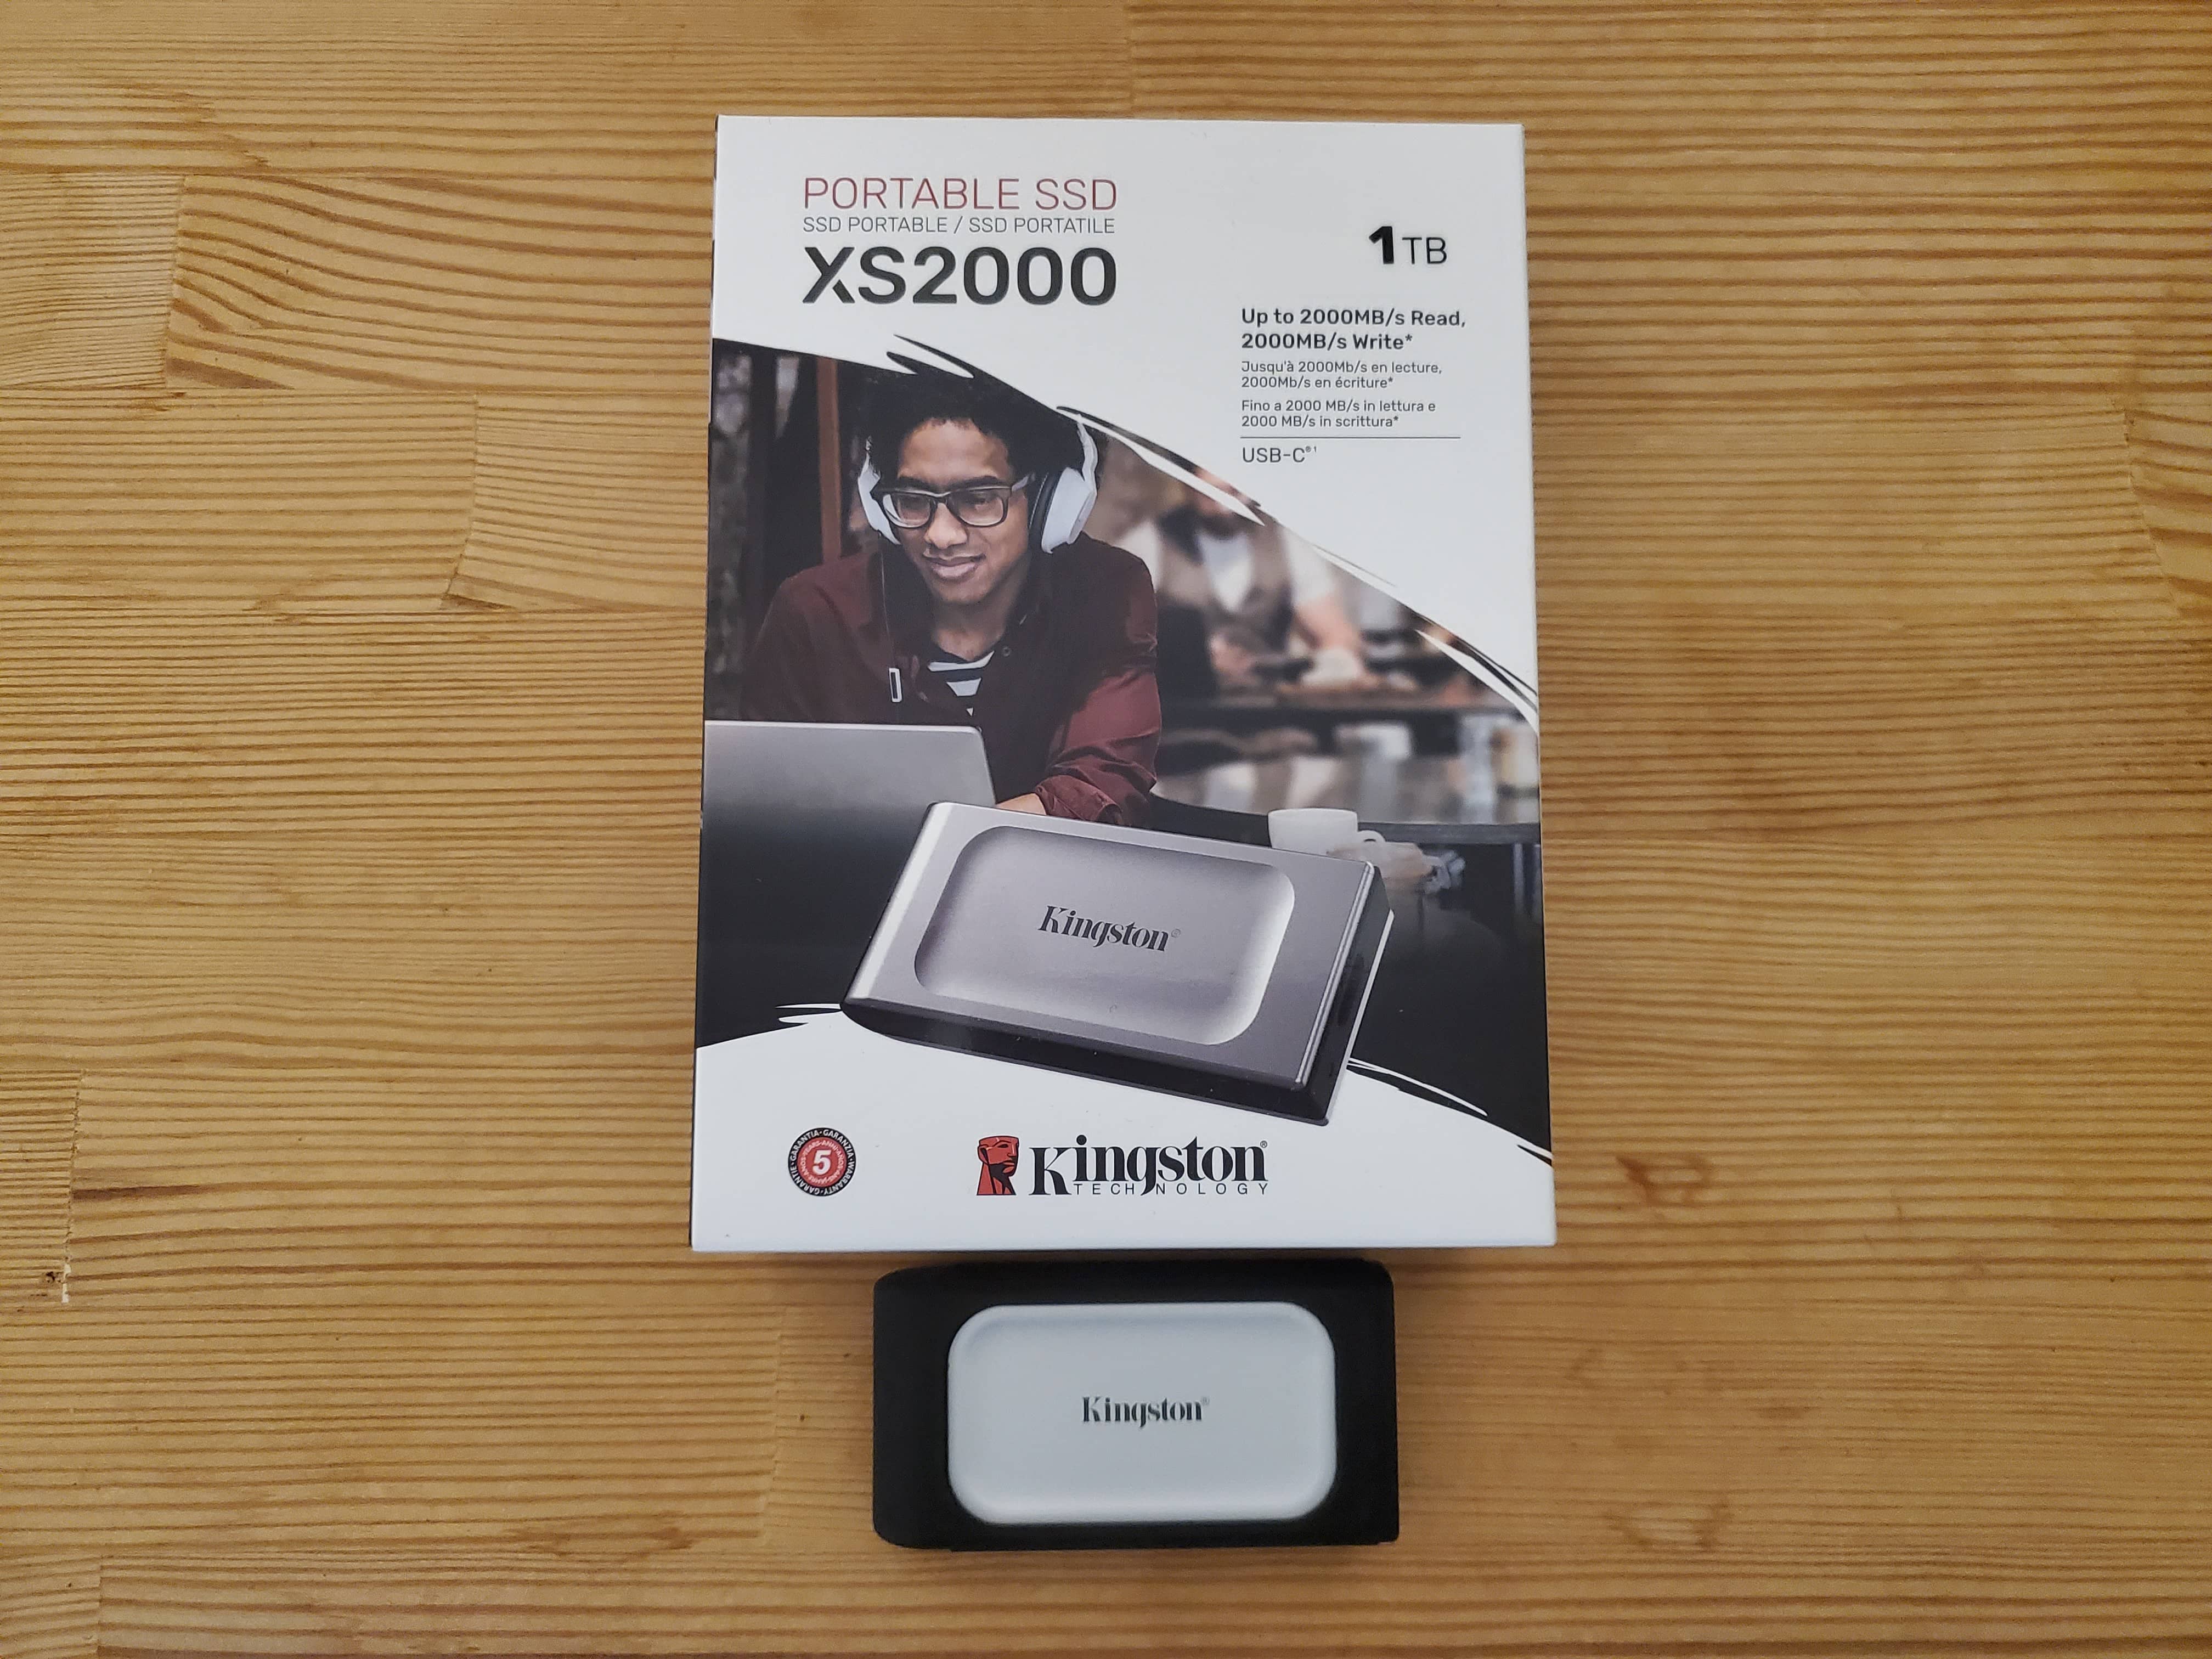
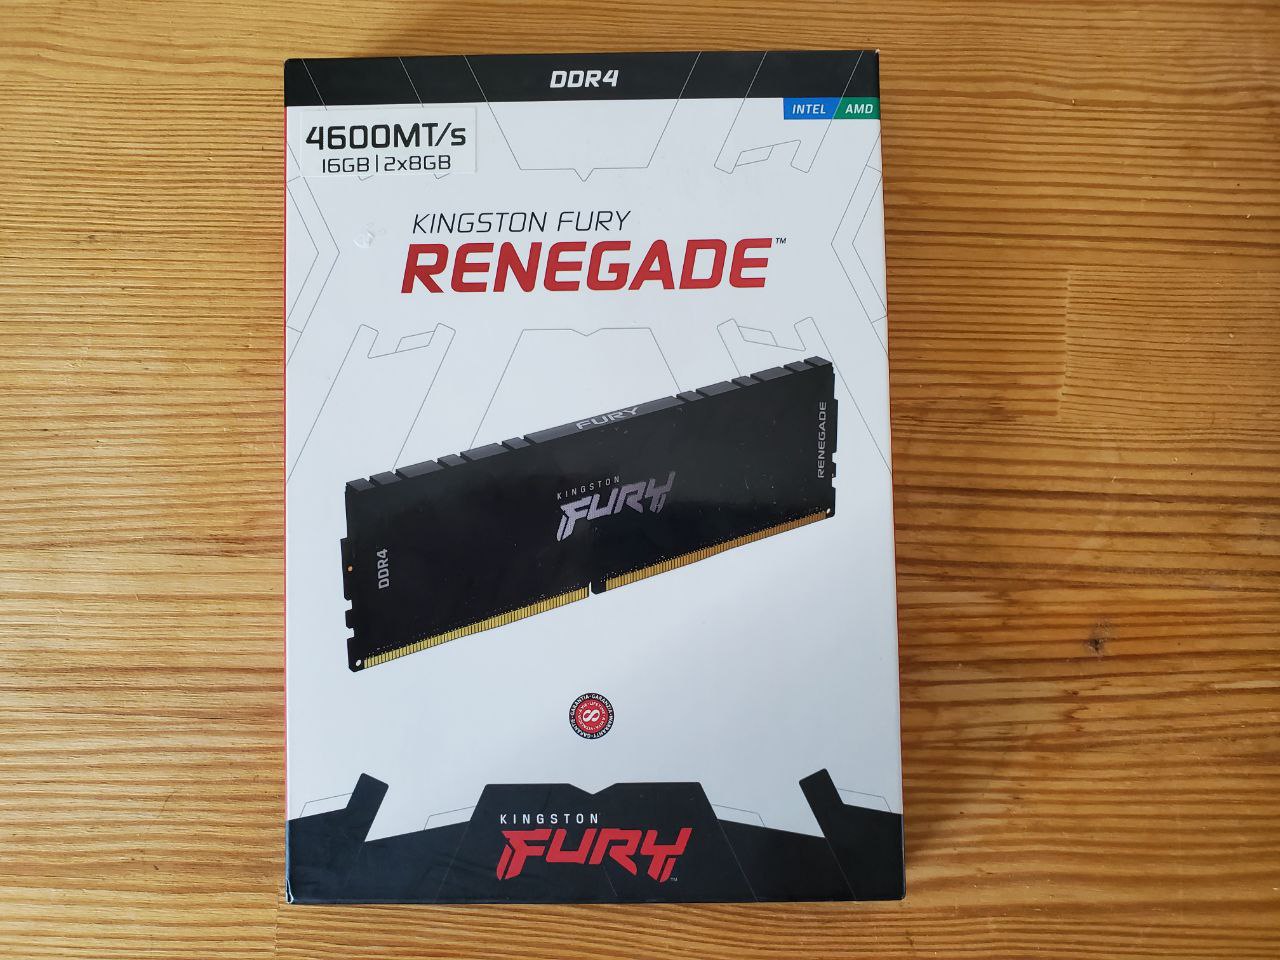
In our review, we used RAM: 32 GB DDR4 3600 CL16 Kingston FURY Renegade , 32 GB DDR4 4000 CL18 Kingston FURY Renegade , 32 GB DDR5 6000 Kingston FURY Renegade, 16 GB DDR4 4600 CL19 Kingston FURY Renegade and 32 GB DDR5 7 200 Kingston FURY Renegade . And for gaming tests we use an external Kingston XS2000 Portable SSD 1 TB ..
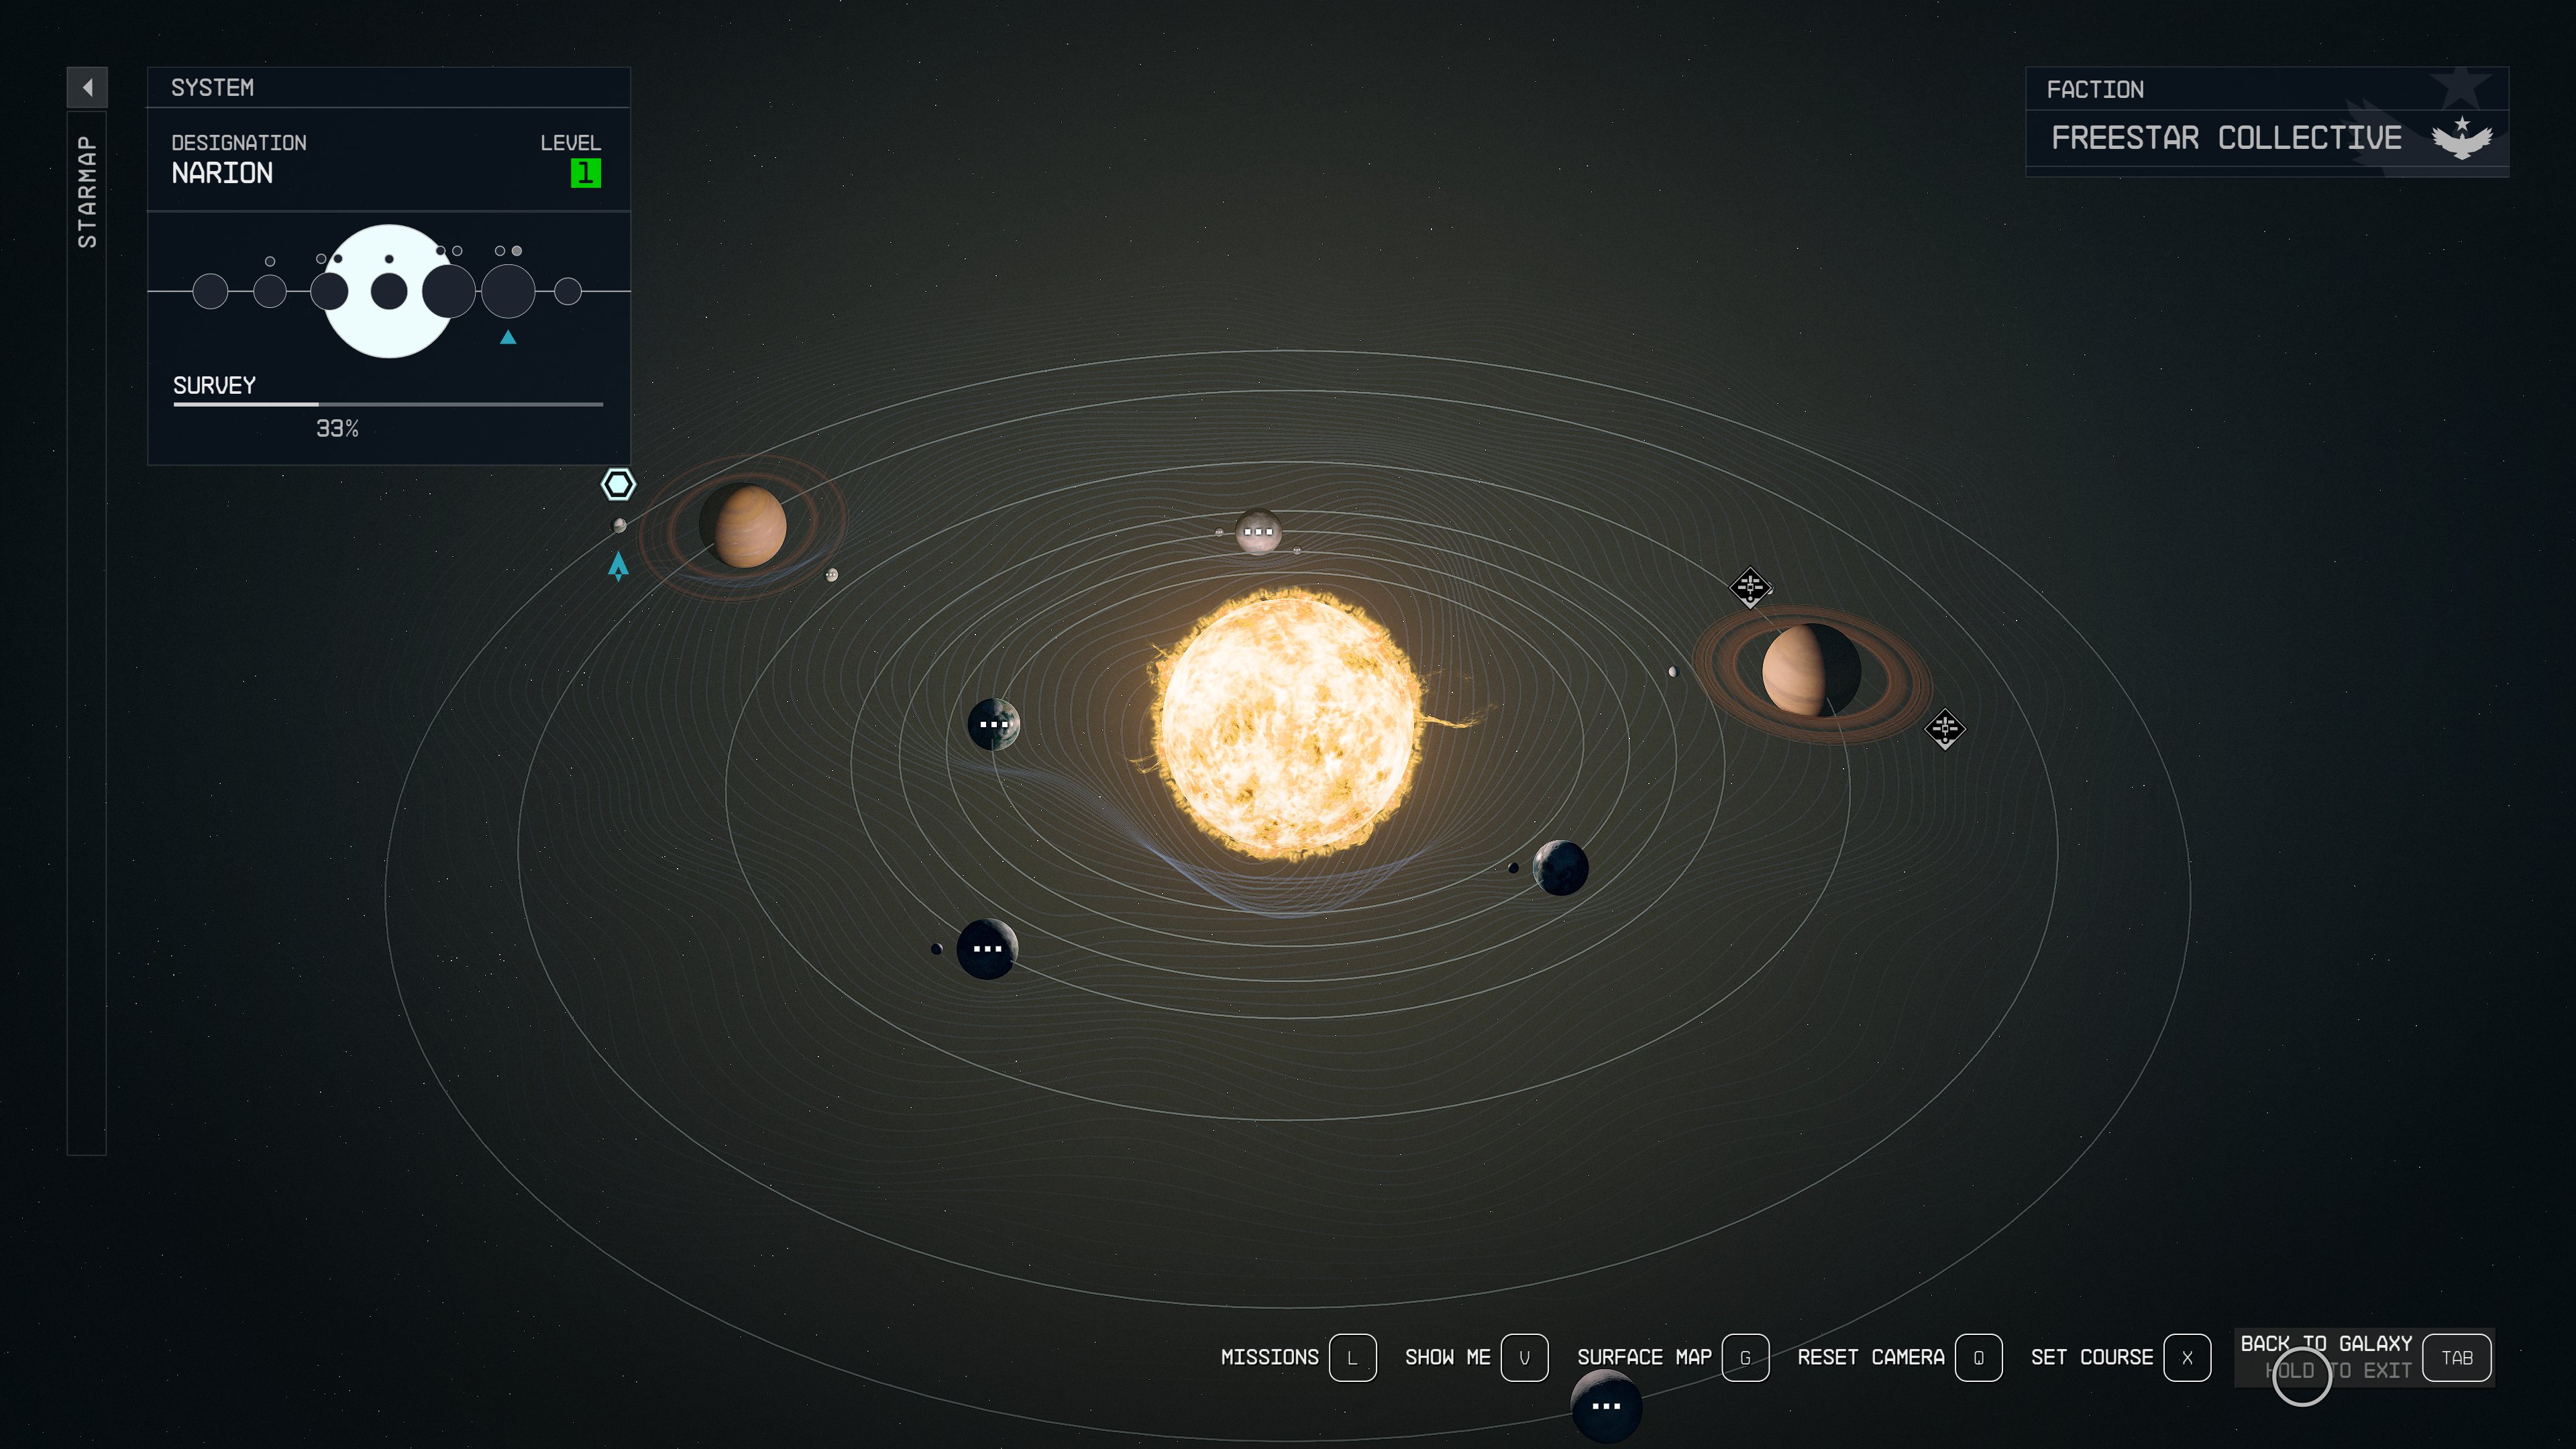
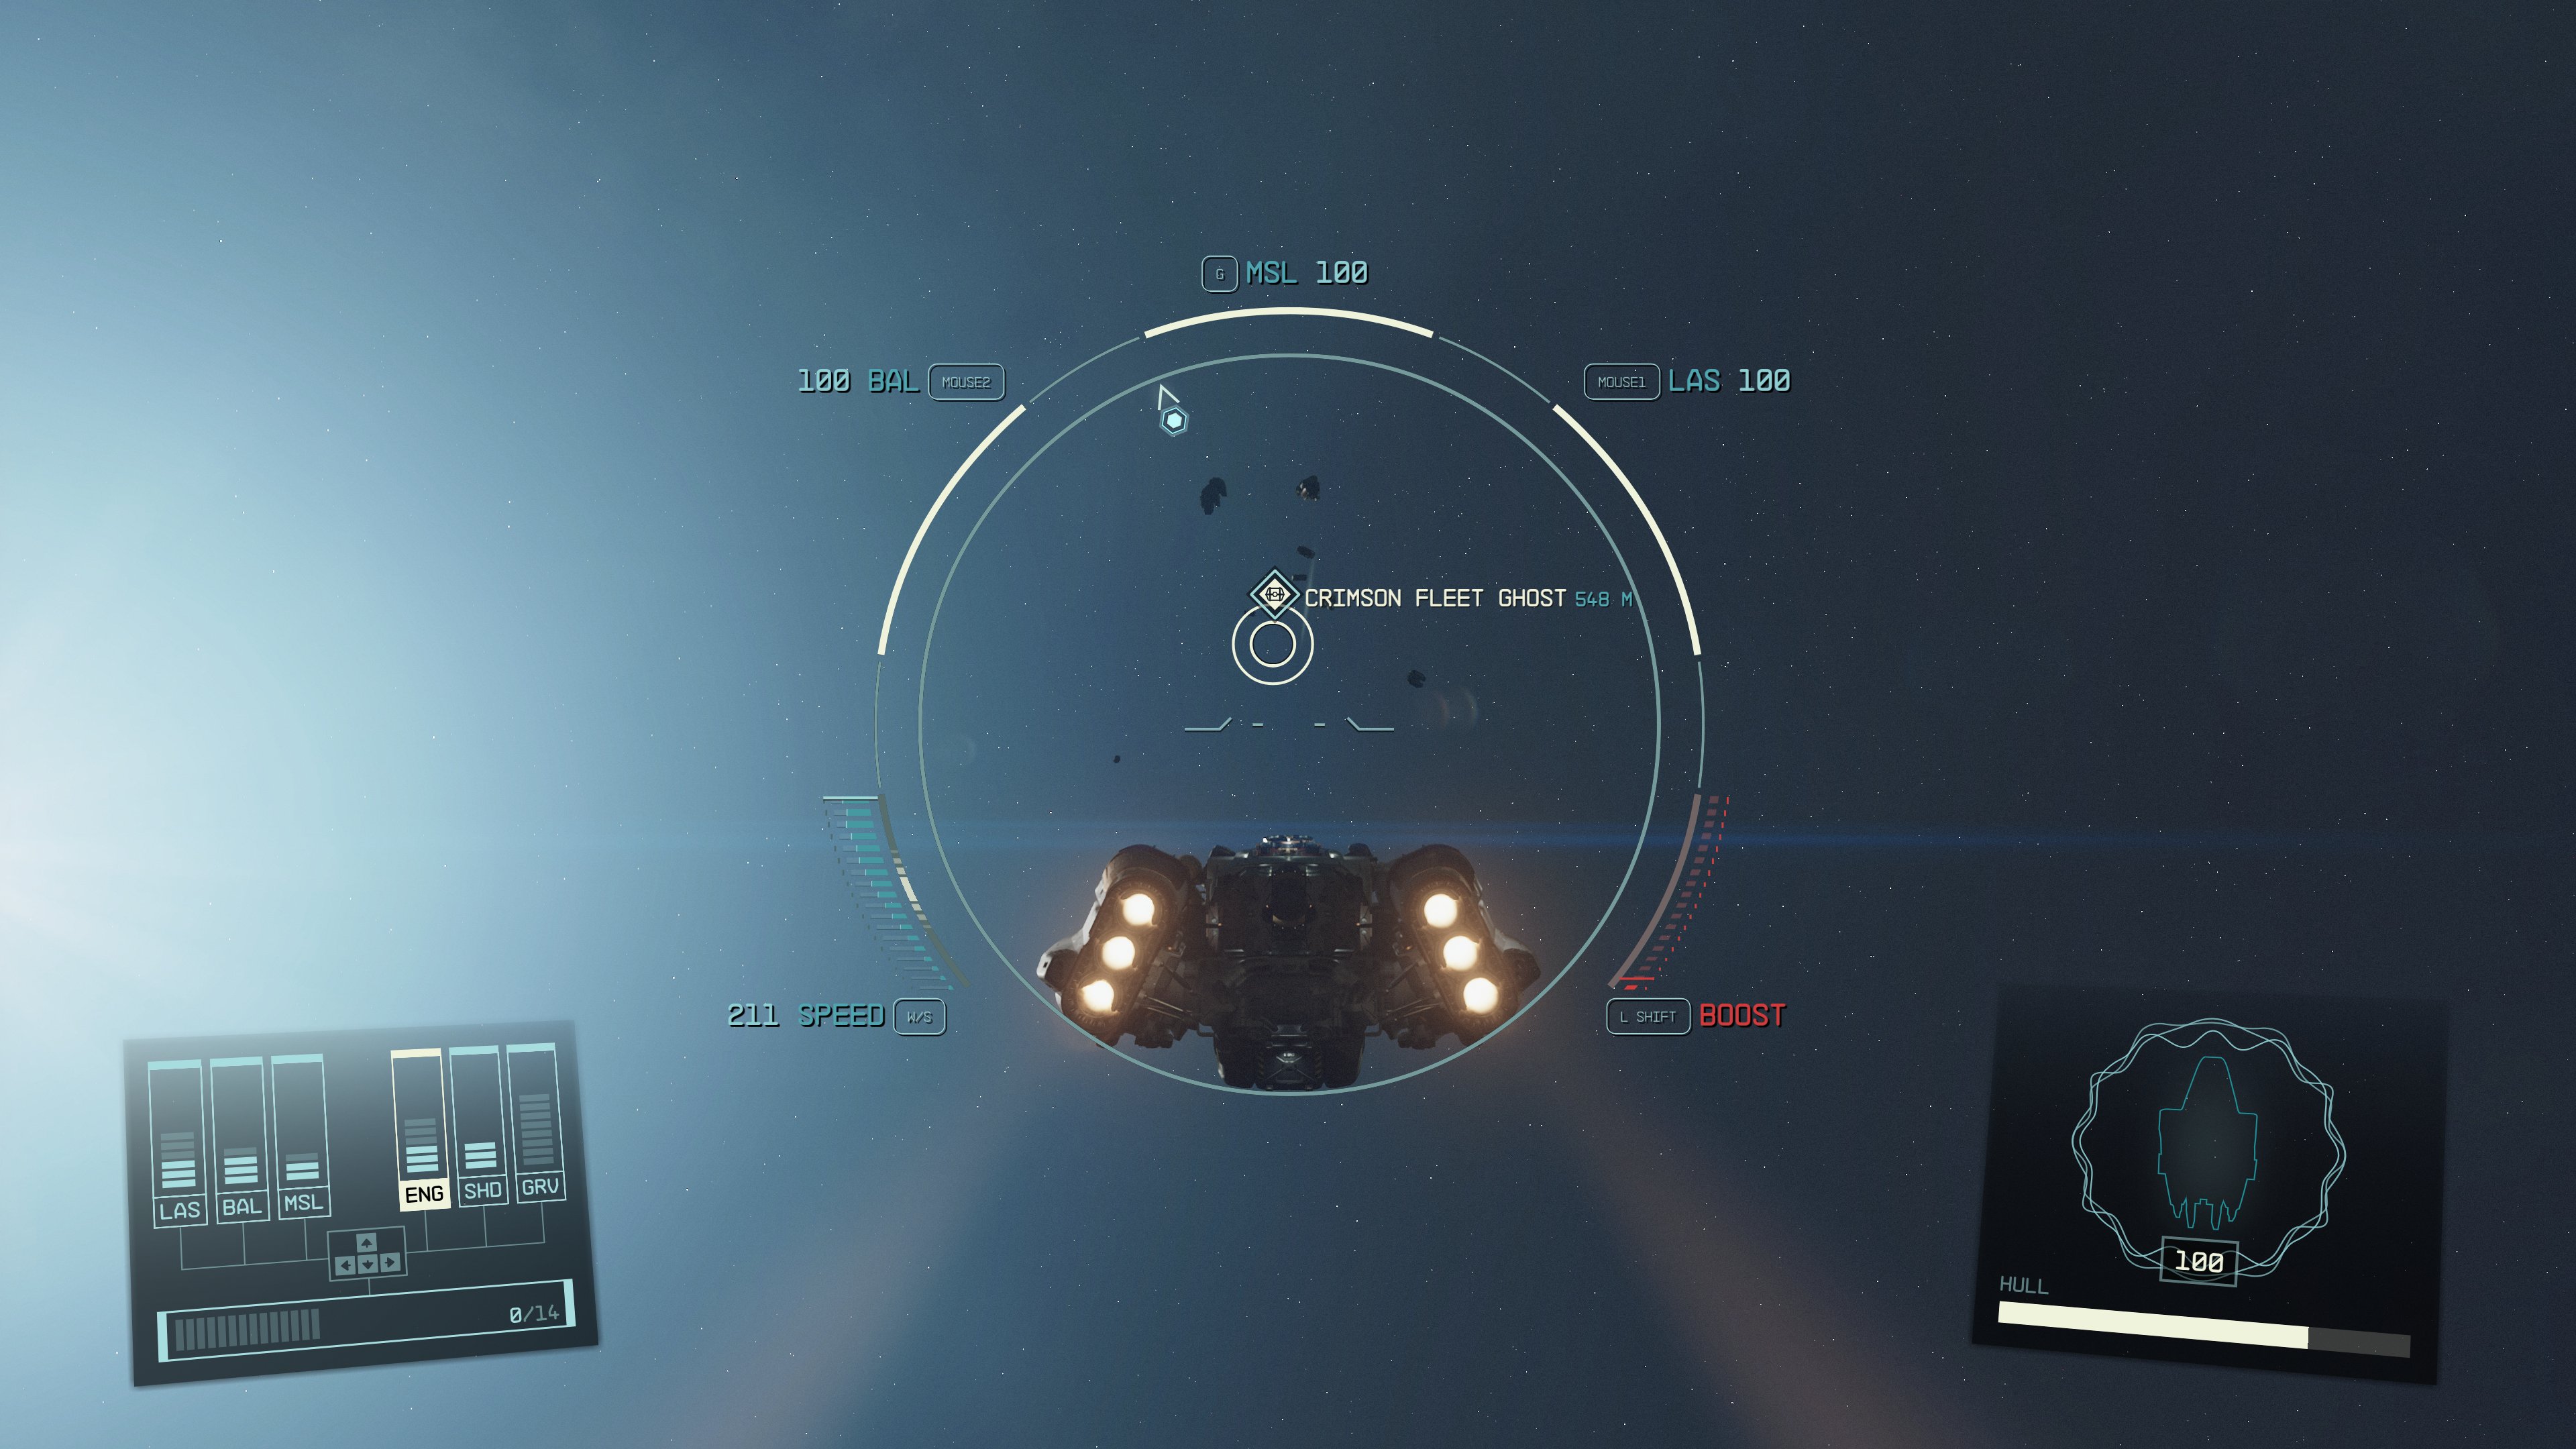
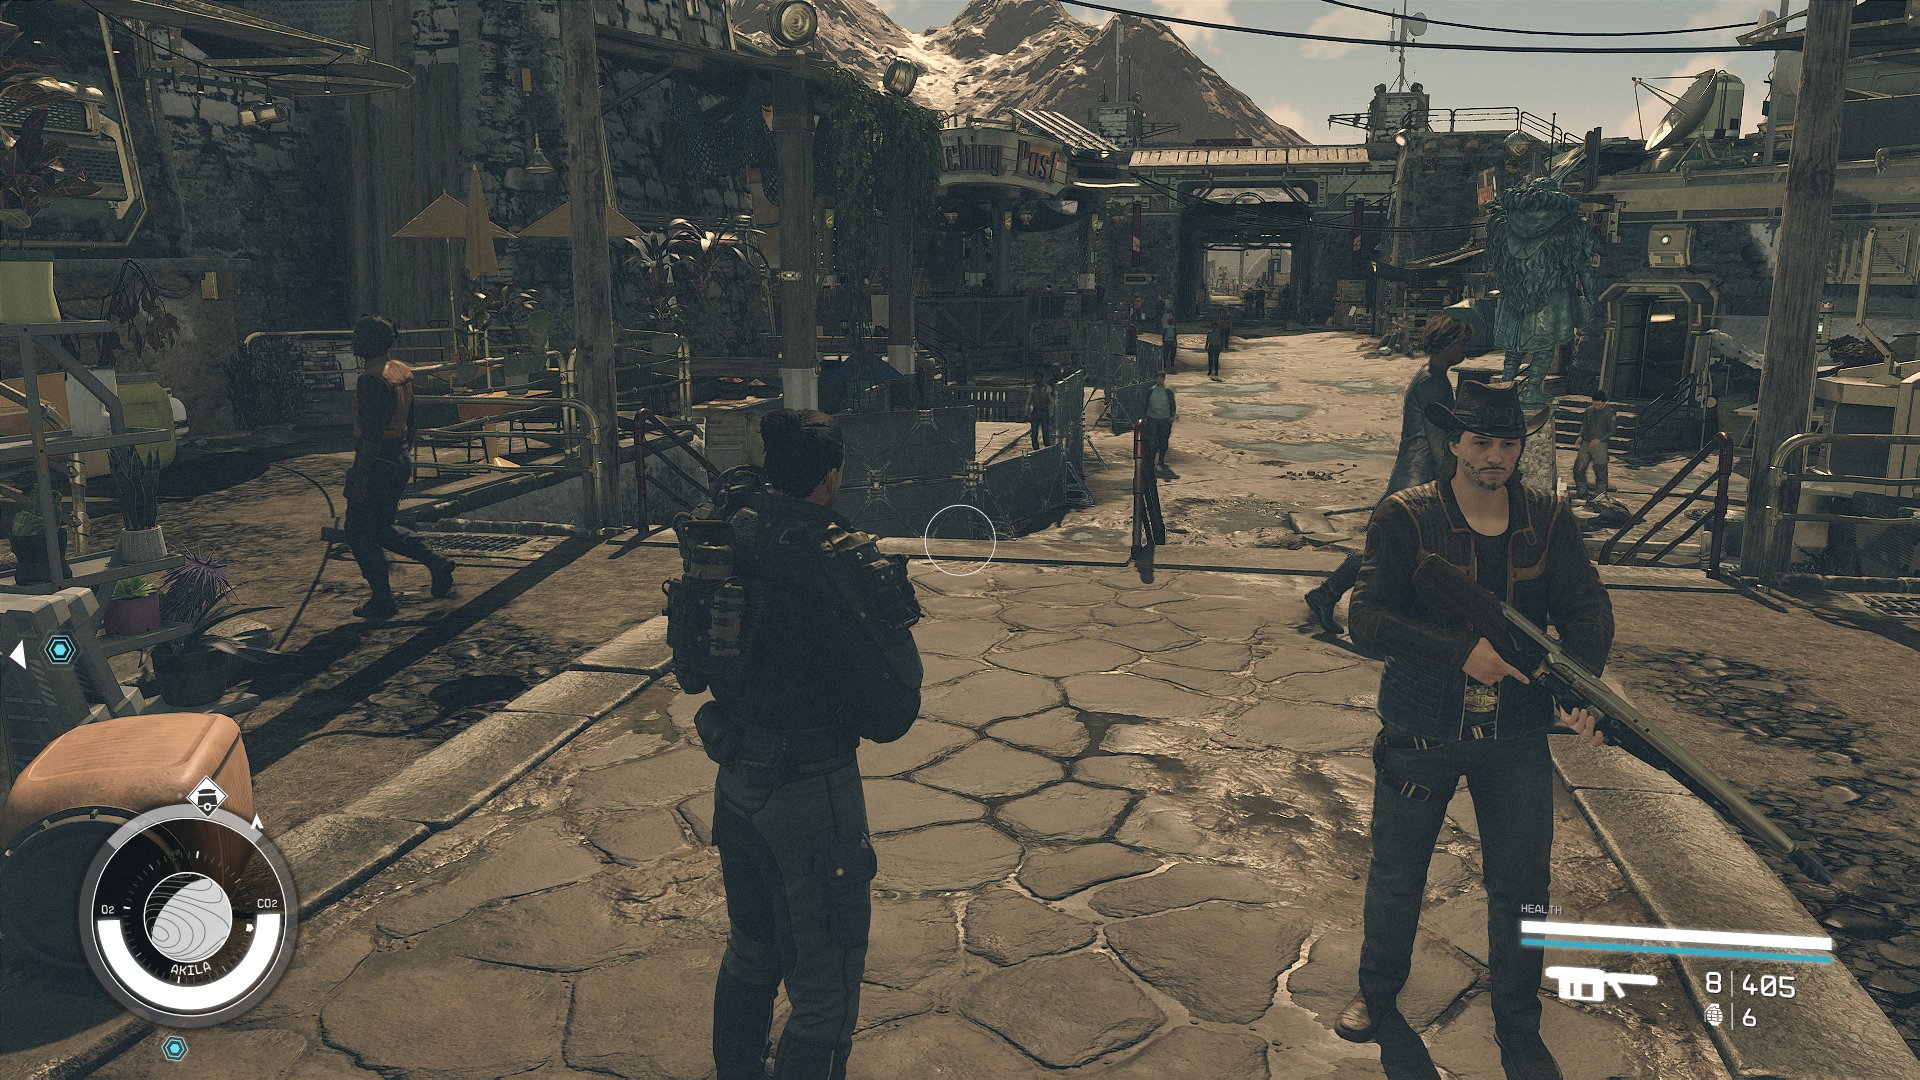
| THE GRAFICAL PART |
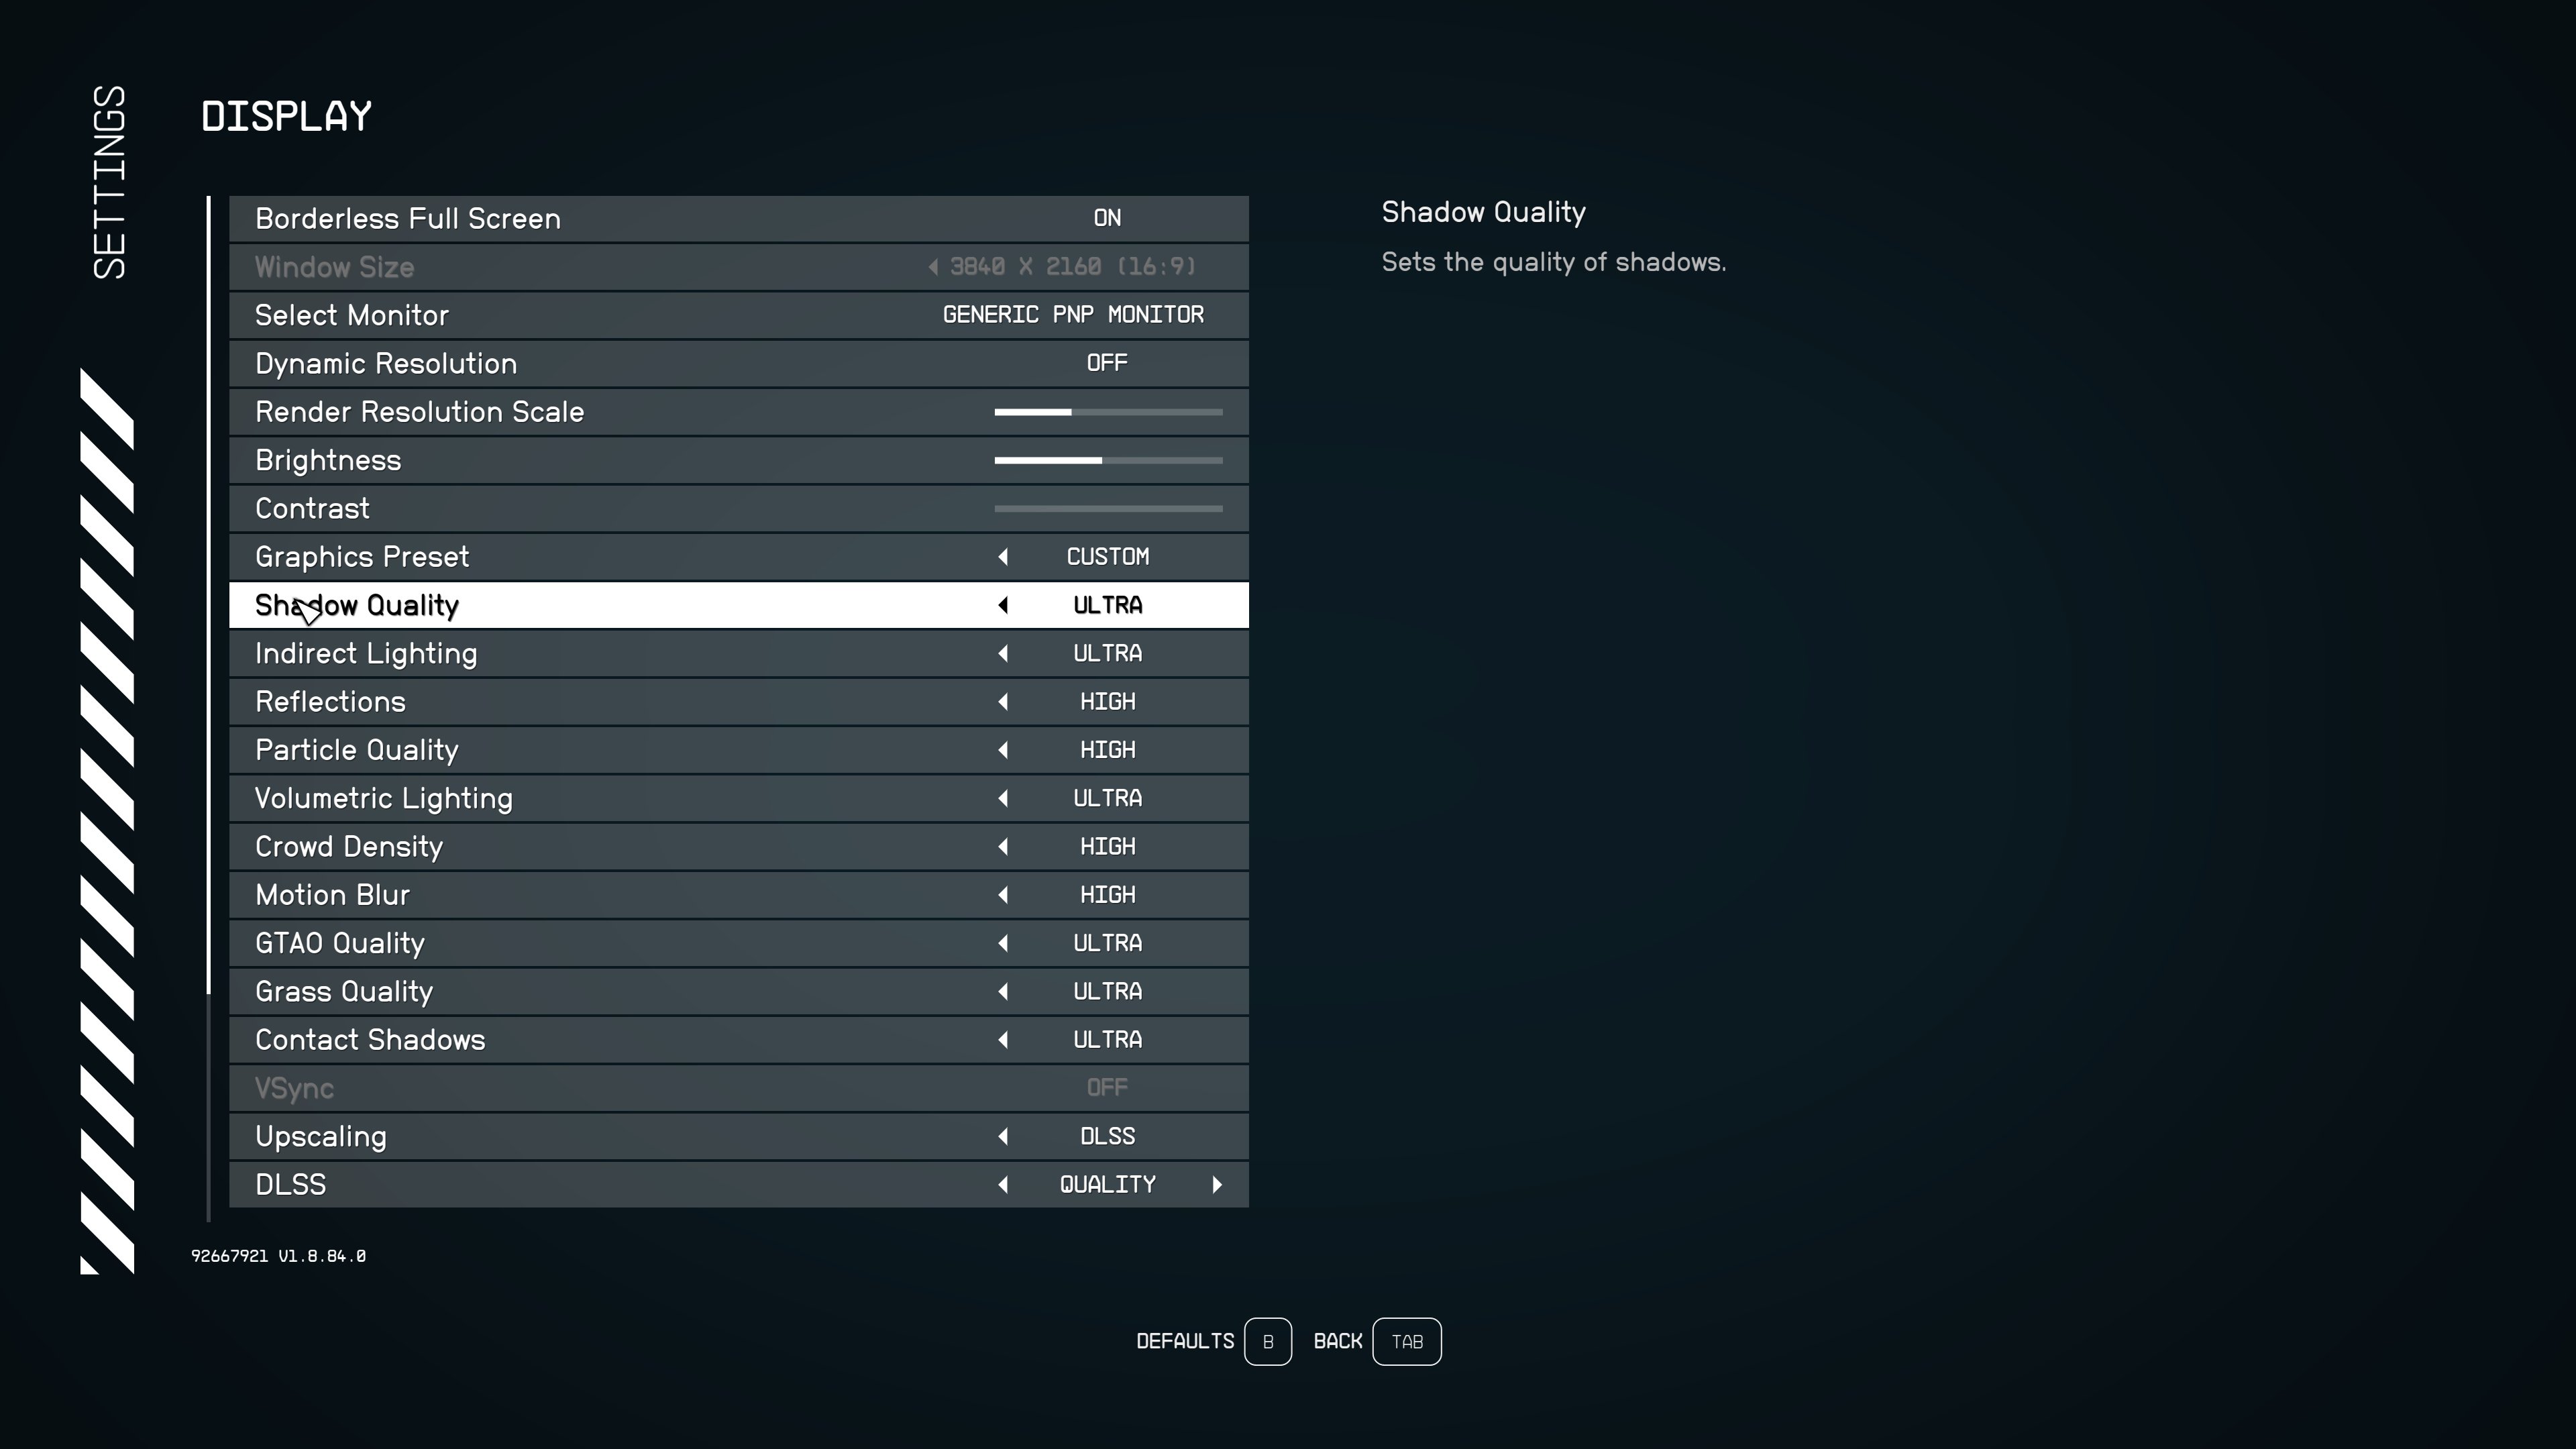
This subsection of our review highlights the main graphical aspects of this game. Particular attention is paid to the version of the graphics engine used, the version of the API used, graphic settings and the quality of development of the main visual aspects.
| SUPPORTED OS AND GRAPHICS API |
Starfield is supported by Windows 10/11.
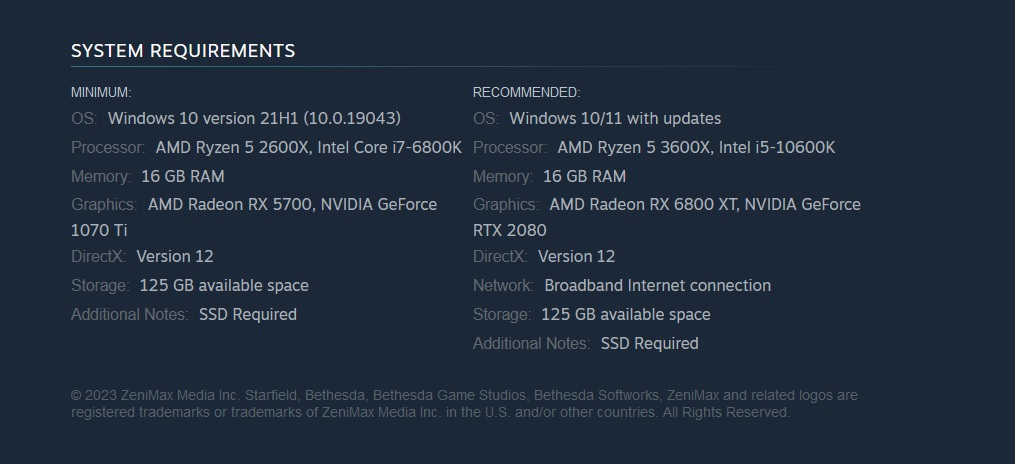
The priority and primary graphics API for Starfield is DX12 .
| GAME ENGINE |


| DIFFERENT QUALITY MODES |

| TEST PART |
| Test configuration | |
| Test benches |
ROG Strix X570-E Gaming Z490 AORUS PRO AX GIGABYTE Z590 VISION GIGABYTE Z690 AERO G GIGABYTE Z790 GAMING X AX MSI MPG Z790 Edge WiFi ASUS ROG Strix B650-A Gaming WiFi |
| Sponsored video cards |
ASUS ROG Strix GeForce RTX 4070 Ti OC ASUS TUF Gaming Radeon RX 7900 XT 20G Gigabyte GeForce RTX 4060 Ti GAMING OC |
| Multimedia equipment |
Monitor Philips 326M6VJRMB/00 Seasonic PRIME TX-1000 power supply 16 GB DDR4 4600 CL19 Kingston FURY Renegade 32 GB DDR4 3600 CL16 Kingston FURY Renegade 32 GB DDR4 4000 CL18 Kingston FURY Renegade 32 GB DDR5 5600 CL40 KingstonFURY Beast 32 GB DDR5 6000@6400 CL30 KingstonFURY Renegade 32 GB DDR5 7200@7600 CL36 KingstonFURY Renegade Kingston FURY Renegade PCIe 4.0 NVMe M.2 SSD MPG CORELIQUID K240 housing Case DeepCool CH510 WH SVO DeepCool LS720 WH |
| Software configuration |
|
| operating system | Windows 10 21H2/ Windows 11(Alder Lake) |
| Graphics driver |
Nvidia GeForce/ION Driver Release 546.17 WHQL AMD Software: Adrenalin Edition 23.11.1 |
| Monitoring programs |
MSI Afterburner |
Our video cards were tested at resolutions of 1920x1080 , 2560x1440 and 3840x2160 with maximum graphics quality settings.
| GPU TEST |
In the video card test, the default resolution is 1920x1080; other resolutions are added and removed manually. You can also remove and add any positions of video cards. You can also select any of our test processors from the list in the drop-down menu, comparing its performance with the given video card tests (by default, the most productive solution is selected). The test is carried out on the most powerful CPU in this game and is scaled to other processors, taking into account their testing on NVIDIA and AMD video cards.

At a resolution of 1920x1080, an average FPS of 25 frames was shown by video cards of the Radeon RX 6600 or GeForce RTX 2060 level . A minimum FPS of at least 25 frames can be provided by video cards of the Radeon RX 6600 or GeForce RTX 2060 level . A comfortable average FPS of 60 frames can be provided by Radeon RX 6800 or GeForce RTX 3080 solutions .
At a resolution of 2560x1440 , an average FPS of 25 frames was shown by video cards of the Radeon RX 6600 XT or GeForce RTX 2080 level . A minimum FPS of at least 25 frames can be provided by video cards of the Radeon RX 6700 XT or GeForce RTX 2080s level . A comfortable average FPS of 60 frames can be provided by Radeon RX 6800 XT or GeForce RTX 4070 Ti solutions .
At a resolution of 3840x2160, an average FPS of 25 frames was shown by video cards of the Radeon RX 6800 or GeForce RTX 4070 level . A minimum FPS of at least 25 frames can be provided by video cards of the Radeon RX 6800 or GeForce RTX 4070 level . A comfortable average FPS of 60 frames can be provided by Radeon RX 7900 XTX or GeForce RTX 4090 solutions .
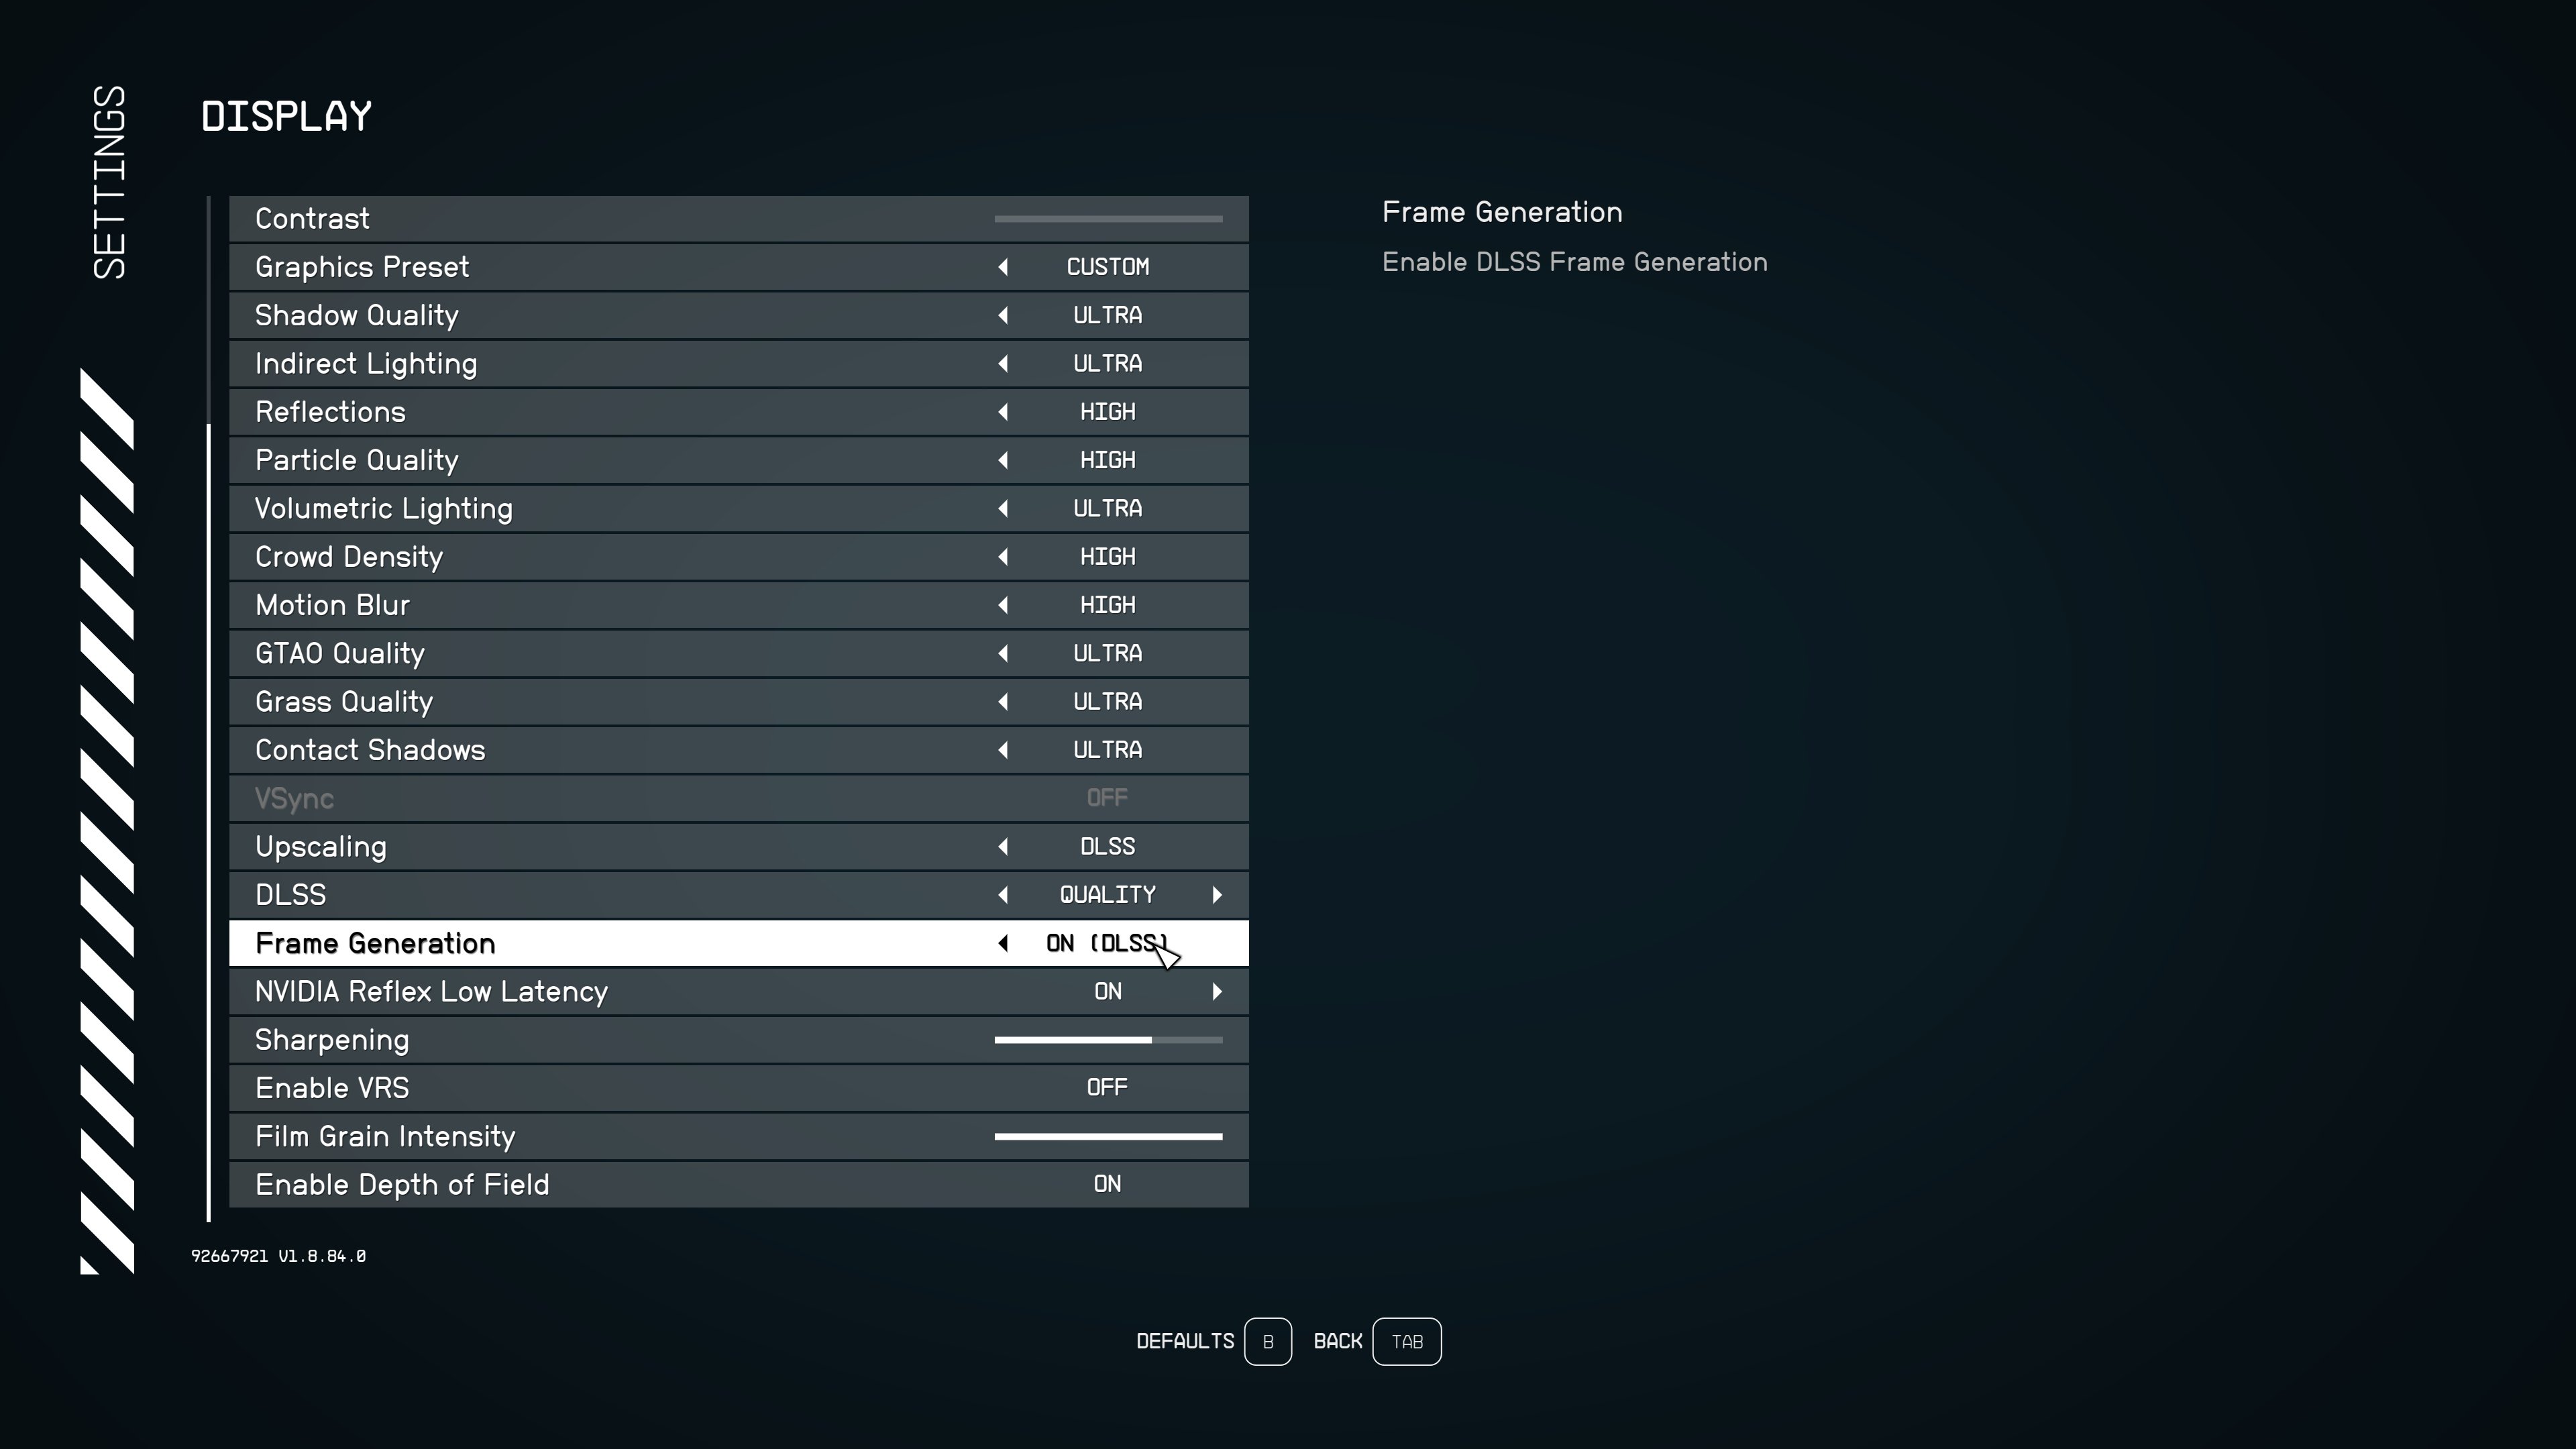
Frame Generation
At a resolution of 1920x1080, an average FPS of 25 frames was shown by video cards of the GeForce RTX 4060 Ti level . A minimum FPS of at least 25 frames can be provided by video cards of the GeForce RTX 4060 Ti level . A comfortable average FPS of 60 frames can be provided by GeForce RTX 4060 Ti solutions .
At a resolution of 2560x1440, an average FPS of 25 frames was shown by video cards of the GeForce RTX 4060 Ti level . A minimum FPS of at least 25 frames can be provided by video cards of the GeForce RTX 4060 Ti level . A comfortable average FPS of 60 frames can be provided by GeForce RTX 4060 Ti solutions .
At a resolution of 3840x2160, an average FPS of 25 frames was shown by video cards of the GeForce RTX 4060 Ti level . A minimum FPS of at least 25 frames can be provided by video cards of the GeForce RTX 4060 Ti level . A comfortable average FPS of 60 frames can be provided by GeForce RTX 4070 Ti solutions .
| VIDEO MEMORY CONSUMPTION |
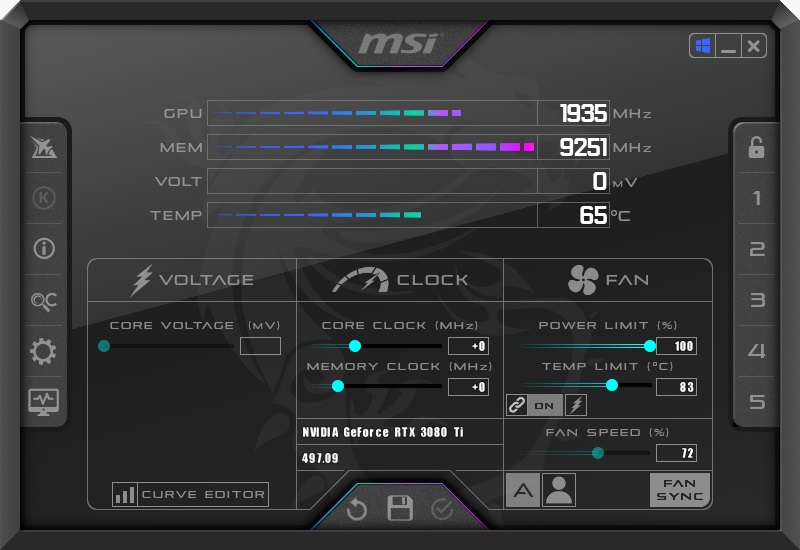
Testing of video memory consumed by the game was carried out by MSI Afterburner. The indicator was based on results on video cards from AMD and NVIDIA at resolutions of 1920x1080, 2560x1440 and 3840x2160 with various anti-aliasing settings. By default, the graph displays the most current solutions. Other video cards are added and removed from the chart at the request of the reader.
GameGPU
At a resolution of 1920x1080 , video memory consumption for video cards with 8 gigabytes is 6 gigabytes , with 12 gigabytes 6 gigabytes , with 16 gigabytes 6 gigabytes , with 24 gigabytes 7 gigabytes .
At a resolution of 2560x1440 , video memory consumption for video cards with 8 gigabytes is 6 gigabytes, with 12 gigabytes 6 gigabytes , with 16 gigabytes 7 gigabytes , with 24 gigabytes 7 gigabytes .
At a resolution of 3840x2160 , video memory consumption for video cards with 8 gigabytes is 7 gigabytes, with 12 gigabytes 7 gigabytes , with 16 gigabytes 8 gigabytes , with 24 gigabytes 8 gigabytes .
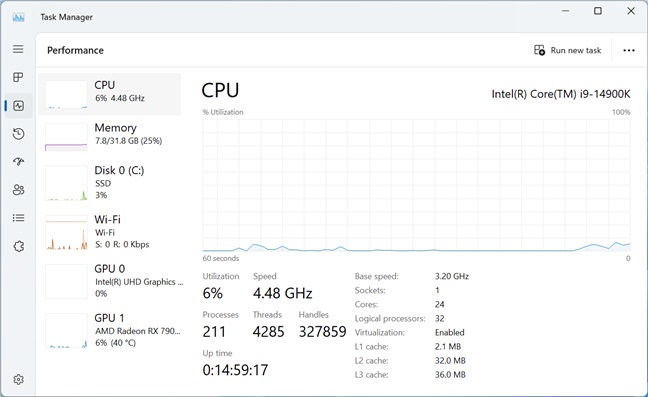
| CPU TEST |
Testing was carried out at a resolution of 1920x1080. In the processor test, you can remove or add any processor positions. You can also select any tested video card from the list in the drop-down menu, comparing its performance with the given processor test results (by default, the most productive solution from NVIDIA is selected). Testing takes place on the most powerful NVIDIA and AMD video cards and scales to low-end models.
When using NVIDIA video cards, Ryzen 3 3100 or Core i 3 10100 processors showed an acceptable rate of at least 25 frames per second , and solutions at the Ryzen 5 7600 or Core i 5 12400 level can provide an FPS rate of at least 60 frames per second .
When using AM D video cards, Ryzen 3 3100 or Core i 3 10100 processors showed an acceptable rate of at least 25 frames per second , and solutions at the Ryzen 7 5700 or Core i 5 12400 level can provide an FPS rate of at least 60 frames per second .
Frame Generation
When using NVIDIA video cards , Ryzen 3 3100 or Core i 3 10100 processors showed an acceptable rate of at least 25 frames per second , and solutions at the Ryzen 3 3300 or Core i 3 10100 level can provide an FPS rate of at least 60 frames per second .
When using AM D video cards, Ryzen 3 3100 or Core i 3 10100 processors showed an acceptable rate of at least 25 frames per second , and solutions at the Ryzen 3 3100 or Core i 3 10100 level can provide an FPS rate of at least 60 frames per second .
GameGPU
The game can load up to 16 streams. Uses up to 12 threads as efficiently as possible.
| RAM TEST |
The test was carried out on the basic configuration of Core i 9 13900K with 32 GB DDR5 6400 MHz pre-installed memory. All used RAM was taken as an indicator. The RAM test for the entire system was carried out on various video cards without launching third-party applications (browsers, etc.). In the graphics, you can add and remove any resolutions and video cards as desired.
GameGPU
At a resolution of 1920x1080 , RAM consumption for video cards with 8 gigabytes is 13 gigabytes , with 12 gigabytes 12 gigabytes , with 16 gigabytes 14 gigabytes, with 24 gigabytes 15 gigabytes .
At a resolution of 2560x1440 , RAM consumption for video cards with 8 gigabytes is 13 gigabytes , with 12 gigabytes 13 gigabytes , with 16 gigabytes 14 gigabytes, with 24 gigabytes 15 gigabytes .
At a resolution of 3840x2160 , the RAM consumption for video cards with 8 gigabytes is 14 gigabytes , with 12 gigabytes 141 gigabytes , with 16 gigabytes 14 gigabytes , with 24 gigabytes 15 gigabytes .
| SPONSORS TESTS |
 |
 |
| |
| |